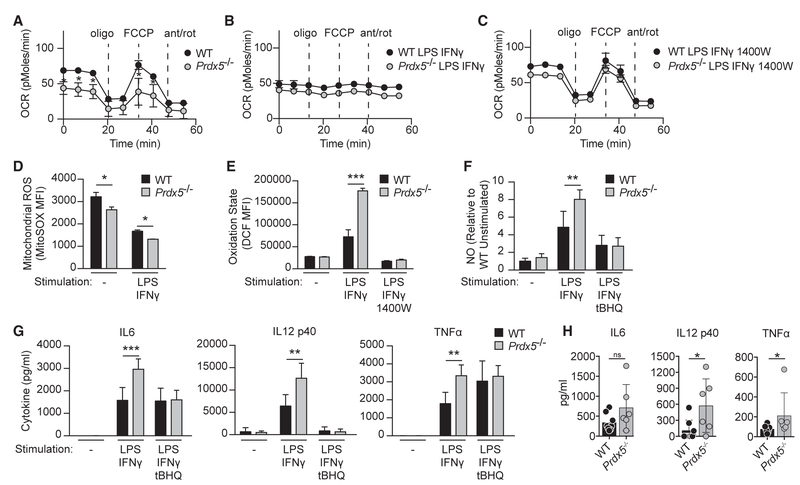
Figure 4. Redox Regulation Attenuates Signaling Pathways Initiated by Microbial Ligands.
(A–C) WT and Prdx5−/− BMDCs were unstimulated (A) or stimulated overnight (ON) with LPS and IFN-γ (B), with and without (C) 1400W pretreatment. Oxidative phosphorylation was monitored by the oxygen consumption rate (OCR) using the Seahorse Extracellular Flux Analyzer.
(D) Mitochondrial ROS production was measured using MitoSOX in WT and Prdx5−/− BMDCs at basal state and after ON stimulation with LPS and IFN-γ.
(E) Cellular oxidation state was measured using DCFDA in WT and Prdx5−/− BMDCs at basal state and after ON stimulation with LPS and IFN-γ, with and without 1400W pretreatment.
(F) Nitric oxide production was measured using the Griess assay in WT and Prdx5−/− BMDCs at basal state and after ON stimulation with LPS and IFN-γ, with and without tBHQ pretreatment.
(G) Cytokine production was measured by cytometric bead array in WT and Prdx5−/− BMDCs at basal state and after ON stimulation with LPS and IFN-γ, with and without tBHQ pretreatment.
(H) Serum cytokine response 36 (IL-6 and TNF-α) or 65 (IL-12 p40) hr after infection with Listeria monocytogenes.
*p < 0.05; **p < 0.01; ***p < 0.005; ns, not significant. See also Figures S1, S2, S3, S4, and S5.

