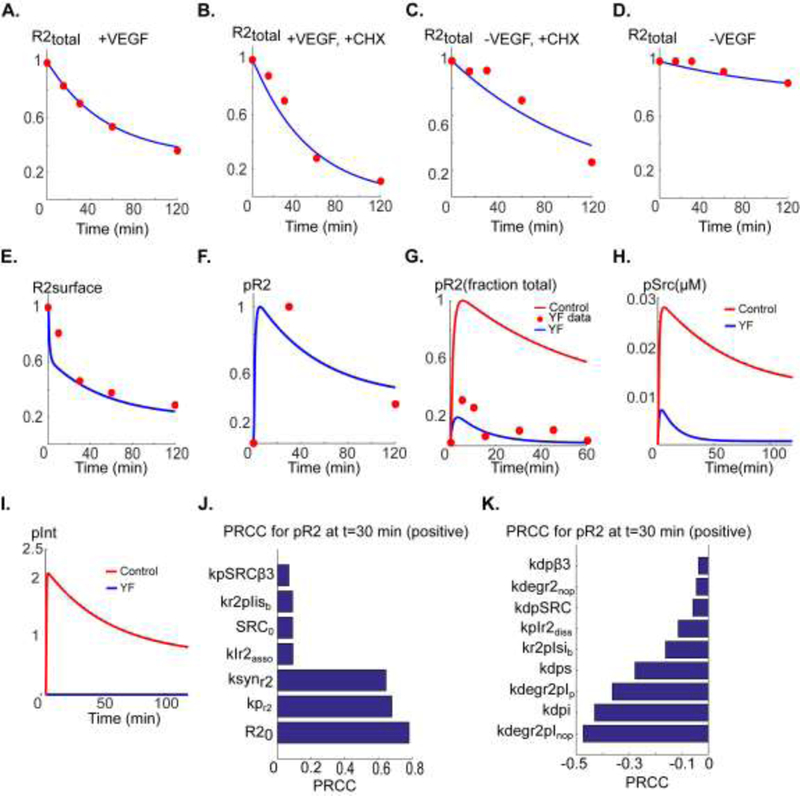
Figure 2. Model parameterization and global sensitivity analysis.

A. Total fraction VEGFR2 level (normalized to VEGFR2 at t=0) versus time in the presence of 50 ng/ml VEGF fitted to data in (Bruns et al., 2010) (red circles). B. Total VEGFR2 in the presence of VEGF and cycloheximide (CHX) fitted to the data in (Bruns et al., 2010). C. Total VEGFR2 in the presence of CHX with no VEGF included. D. Control decline in total VEGFR2 in the absence of VEGF fitted to the data in (Bruns et al., 2010). E. Surface level VEGFR2 fitted to the data in (Ewan et al., 2006). F. pR2 versus time fitted to the data in (Bruns et al., 2010). G. pR2 versus time for the case of Yβ3F mutation resulting in no activation-induced binding of αVβ3 to VEGFR2 fitted to the data from DiYF knock-in mouse model in (Mahabeleshwar et al., 2006) (red circles). The control trace is also shown (red trace). H. Predicted Src activation for the case Yβ3F mutation (blue) relative to control (red). I. Predicted integrin activation in Yb3F mutant (blue) relative to control (red). J. Ranking of the sensitive positively correlated parameters with pR2 at 30 min. K. Ranking of the negatively correlated parameters with PRCC.
