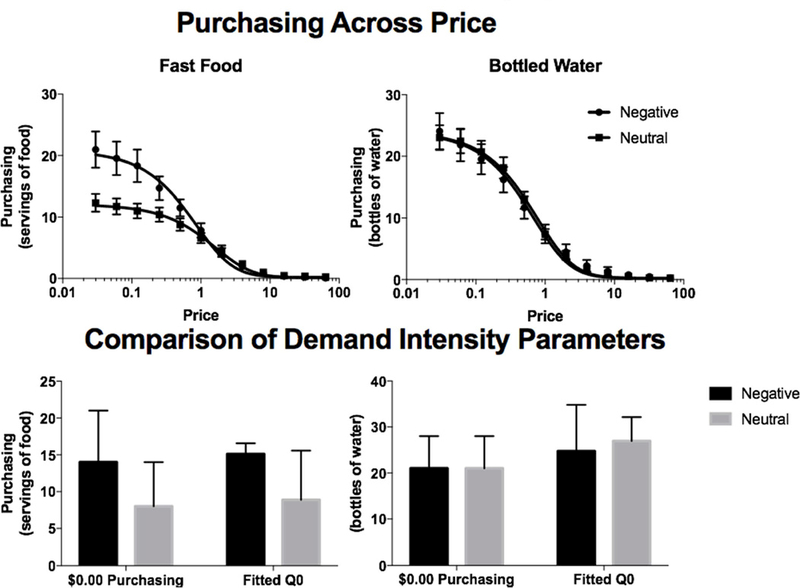
FIGURE 2: Purchasing of Food and Bottled Water.

Figure 2 depicts purchasing of both fast food (left side) and bottled water (right side) between negative income shock and neutral narrative groups. In the top two panels, the X axis indicates price and the Y indicates quantity purchased. Points indicate mean purchasing at each price within groups, and bars indicate SEM. In the bottom two panels, the X axis indicates measure of demand intensity and the Y axis indicates the quantity purchased. Bars are located at medians and errors indicated are 95% confidence intervals.
