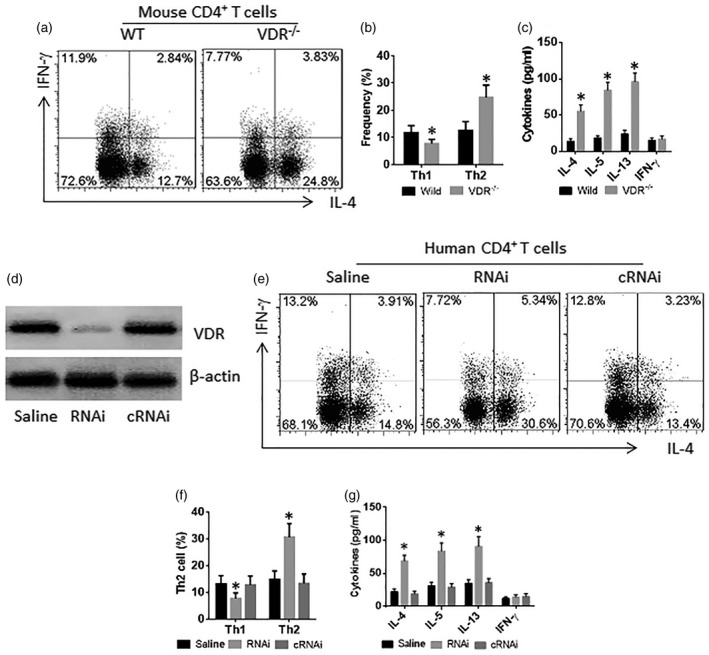
Figure 3.

Vitamin D receptor (VDR)–/–CD4+ T cells are prone to differentiating to T helper type 2 (Th2) cells. (a–c) Spleen cells were prepared from wild‐type (WT) mice and VDR–/– mice. The cells were exposed to phorbol myristate acetate (PMA) (10 ng/ml)/ionomycin (100 ng/ml) (c) in the culture for 72 h. (a) Cells were analysed by flow cytometry. The CD3+CD4+ T cells were gated first (data not shown); the histograms show the frequency of CD4+interferon (IFN)‐+ T cells and CD4+ interleukin (IL)‐4+ T cells. (b) The bars show the summarized data of the gated histograms. (c) The bars show the cytokine levels in the culture supernatant. (d–g) CD3+CD4+ T cells were isolated from healthy subject peripheral blood cells (data not shown); treated with VDR RNAi (RNAi) or control RNAi (cRNAi) (d), and cultured for 72 h in the presence of PMA/ionomycin. (e) The cells were analysed by flow cytometry. The gated histograms show the frequency of IL‐4+ T cells (Th2 cells) and IFN‐γ+ T cells (Th1 cells). (f) The bars indicate the summarized data of gated cells in panel (e). (g) The bars indicate the cytokine levels in the culture supernatant [by enzyme‐linked immunosorbent assay (ELISA)]. The data of bars are presented as mean ± standard deviation (s.d.); *P < 0·01 (t‐test), compared with the wild‐type group. The data represent three independent experiments.
