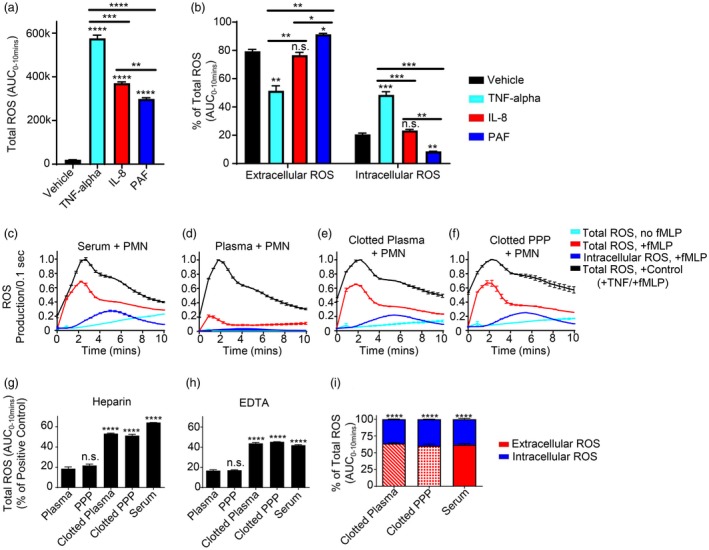
Figure 1.

Polymorphonuclear leucocytes (PMN) are primed for early extracellular reactive oxygen species (ROS) generation by products of coagulation. (a,b) PMN incubated with vehicle control versus the designated known priming agents were measured for priming/ROS generation with addition of 100 nM N‐formylmethionine‐leucyl‐phenylalanine (fMLP) by luminol chemiluminescence with horseradish peroxidase (HRP) (total ROS generation) or superoxide dismutase (SOD) + catalase (intracellular ROS generation). Total and intracellular ROS generated over 10 min was then quantified by integrating the area under the curve (AUC) from 0 to 10 min (total ROS/luminescence generated from 0 to 10 min is shown in (a) to demonstrate the effect of fMLP alone versus priming agent + fMLP on total ROS generation), and extracellular and intracellular ROS was then expressed as a fraction (%) of total ROS generated (where extracellular ROS was measured indirectly by subtracting the intracellular fraction from the total ROS). PMN incubated in 50% (v/v) (c) serum, (d) plasma, (e) clotted plasma and (f) clotted platelet‐poor plasma (clotted PPP) were measured for priming/ROS generation without or with addition of 100 nM fMLP by luminol chemiluminescence with HRP (total ROS generation) or SOD + catalase (intracellular ROS generation). Each condition was normalized to an internal positive PMN priming control [20 ng/ml tumour necrosis factor (TNF)‐α + 100 nM fMLP] to allow for comparison between multiple different blood products. Total amounts of ROS generated for each condition were quantified by integrating the area under the curve (AUC) from 0 to 10 min for experiments performed using (g) heparin and (h) ethylenediamine tetraacetic acid (EDTA) as the initial anti‐coagulant and compared to their respective plasma group. (i) Extracellular versus intracellular ROS at 10 min was then quantified and expressed as a fraction (%) of total ROS generated, where extracellular ROS was measured indirectly by subtracting the intracellular fraction from the total ROS, and the difference between extracellular and intracellular amounts for each blood product were then compared within each group. Results reported as mean ± standard error of the mean (s.e.m.). Significance set at P ≤ 0·05. *P ≤ 0·05; **P ≤ 0·01; ***P ≤ 0·001; ****P ≤ 0·0001.
