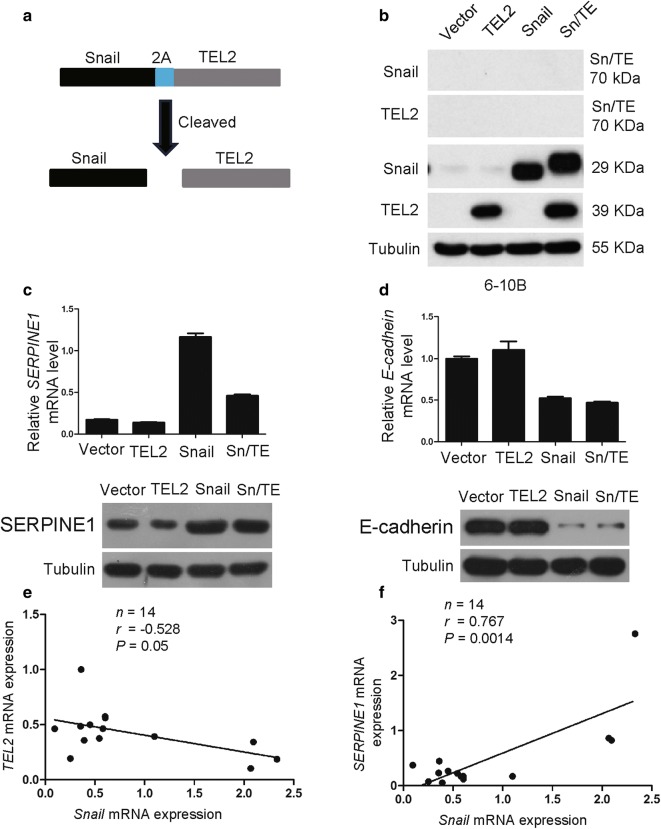
Fig. 4.
The Snail/TEL2/SERPINE1 axis functions in NPC cells. a Schematic illustration for generating a fusion protein of Snail and TEL2 via a T2A linker. b Levels of Snail, TEL2 and Snail-TEL2 proteins were determined by Western blot in the indicated cells. Tubulin was used as a loading control. c Levels of SERPINE1 mRNA were measured by qRT-PCR and levels of SERPINE1 protein by Western blot. GAPDH served as a control. Data are mean ± SEM of triplicate samples. *P < 0.05, **P < 0.01, ***P < 0.001. d Levels of E-cadherin mRNA were measured by qRT-PCR and levels of E-cadherin protein by Western blot. GAPDH served as a control. Data are mean ± SEM of triplicate samples. *P < 0.05, **P < 0.01, ***P < 0.001. e In NPC tissues, a significant negative correlation was observed between Snail and TEL2 expression. f In NPS tissues, a significant positive correlation was observed between Snail and SERPINE1 expression

