Figure 3.
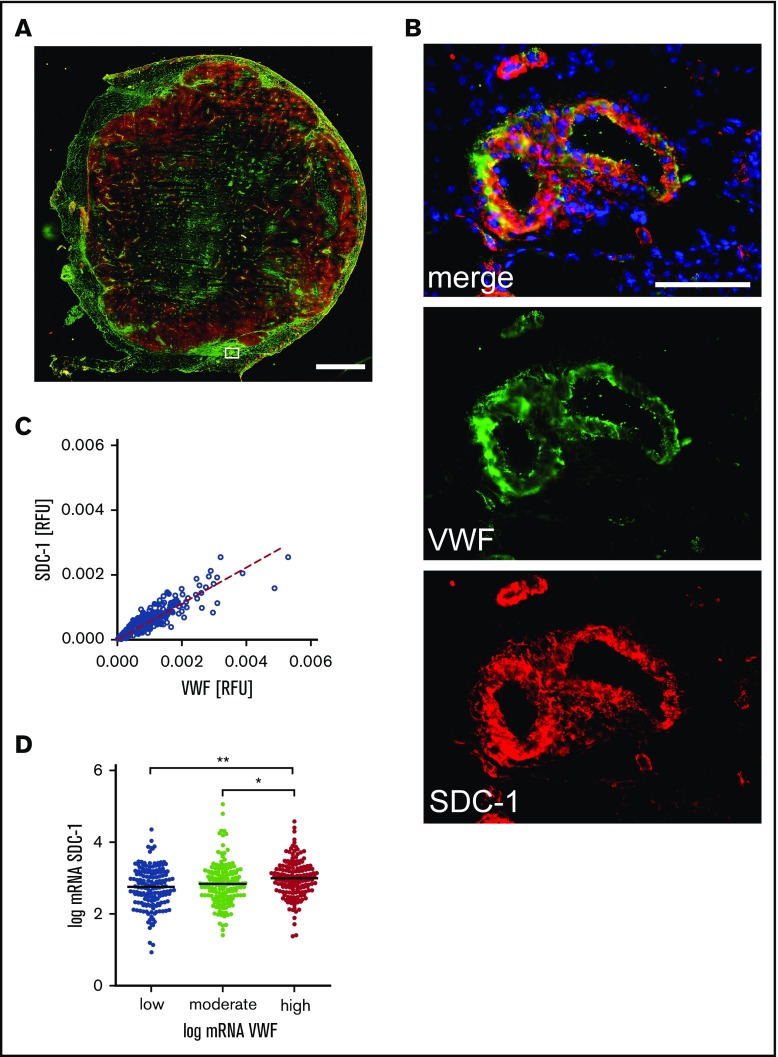
Coexpression of SDC-1 and VWF in melanoma tissue. (A) Representative overview image of a tumor tissue section comprising the primary melanoma and adjacent peritumoral skin. The image was assembled from 156 single immune fluorescence images. Scale bar, 2 mm. The white box marks a skin blood vessel adjacent to the melanoma tissue. The corresponding magnification is depicted in panel B. VWF is shown in green, SDC-1 in red, and cell nuclei in blue. Scale bar, 100 µm. (C) Colocalization of SDC-1 and VWF was quantified in 1649 blood vessels. The dashed line indicates the linear correlation between the expression of VWF and SDC-1. R2 = 0.87; P < .0001 (Spearman’s rank correlation). (D) Transcription analysis confirms correlation of SDC-1 and VWF expression in primary tumors of 479 patients with malignant melanoma. *P ≤ .05, **P ≤ .01 (1-way analysis of variance and Bonferroni post hoc test). mRNA, messenger RNA; RFU, relative fluorescence unit.

