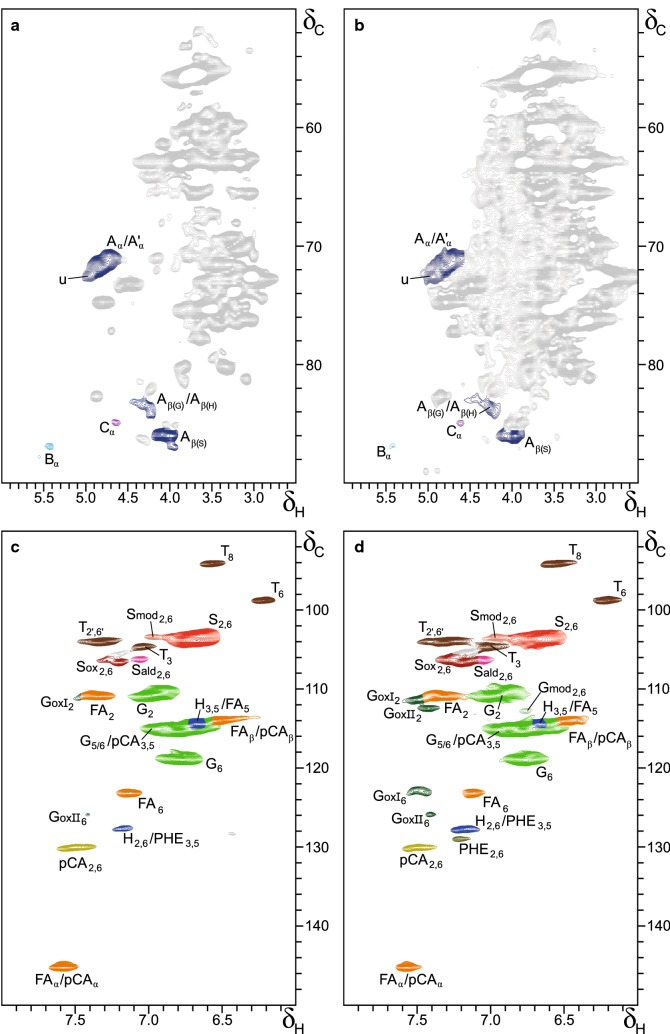
Fig. 4.
HSQC NMR spectra of control and Cs1-treated wheat straw. a, b Aliphatic (δC/δH 50–90/2.5–6.0) region, c, d aromatic/unsaturated (δC/δH 90–160/6.0–8.0) region. Control (a, c), Cs1-treated (b, d). Structures of annotated correlation peaks are presented in Fig. 5. GoxII2 and GoxII6 are tentatively assigned. Gmod and Smod, being unknown derivatives of G and S units, respectively, are presented in a lighter color of the original subunit. Carbohydrate and unassigned signals are presented in gray. u: unassigned signal overlapping Aα/A′α

