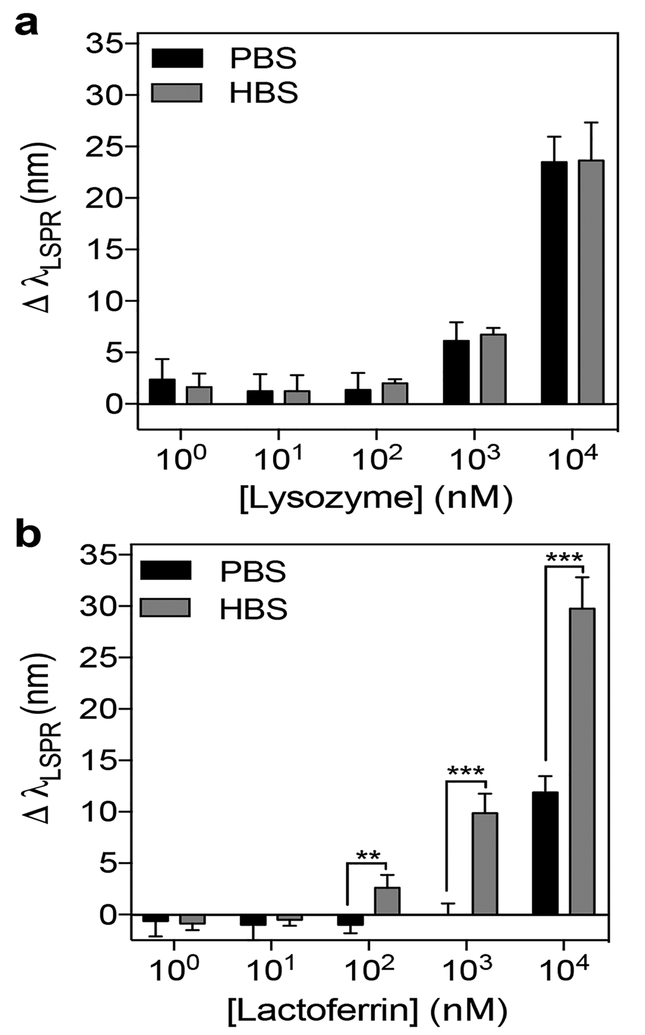
Figure 7. Quantification of AuNS@PNM LSPR shifts for lysozyme and lactoferrin across a wide range of concentrations.
(a) For lysozyme, shifts in LSPR were similar in both buffers (PBS or HBS) for all concentrations tested. (b) For lactoferrin, shifts in LSPR were significantly higher in HBS than in PBS for the three highest concentrations tested. Data are presented as mean ± SD (n=4, Student’s t test, **p<0.01, ***p<0.001).

