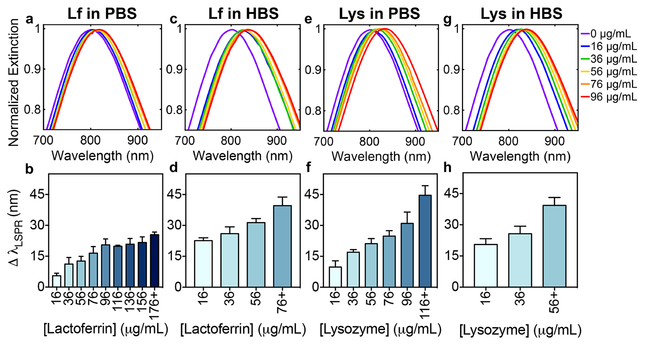
Figure 9. Analysis of LSPR shifts upon variation of individual biomarker concentration in human tears.
Gaussian fits to LSPR peaks of AuNS@PNM normalized extinction spectra and quantitative analysis of shifts in LSPR of AuNS@PNM with increasing concentrations of (a-d) lactoferrin (Lf) or (e-h) lysozyme (Lys) in either PBS or HBS. For clarity, Gaussian fits for high concentrations (i.e., >96 μg/mL) were omitted. Quantitative analysis of shifts in LSPR in PBS for both proteins (b,f) showed a larger dynamic response across the concentrations tested, compared to a narrower dynamic response range observed in HBS (d,h). Data are reported as mean ± SD (n≥3).

