Fig. 8.
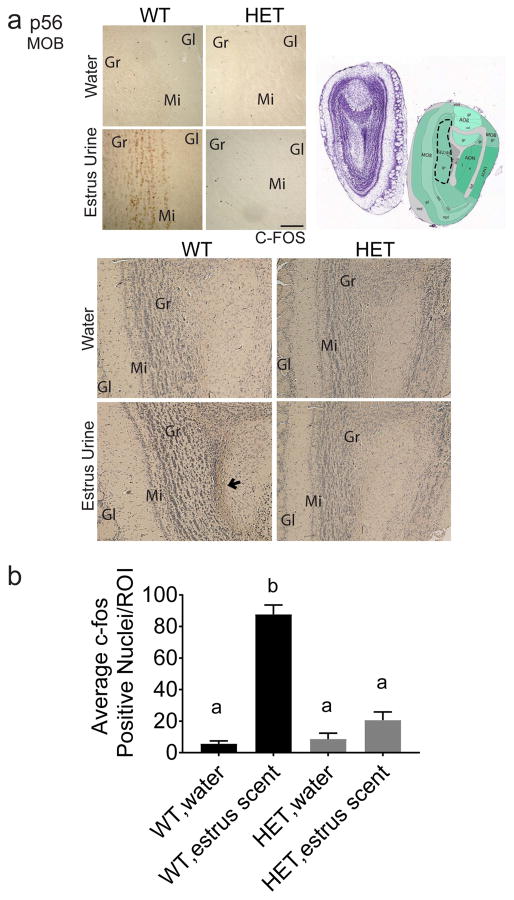
Six3 HET mice lack MOB neuron activation in response to estrus scent. a, Dotted outline indicates quantified portion. Images obtained from the Allen Institute web site, Allen Mouse Brain Atlas, p56 coronal image 20, (http://mouse.brain-map.org). IHC for c-Fos performed to identify regions in the MOB activated by the female urinary volatile odors presented to Six3 WT and HET male mice. Water was used as a negative control. Images are taken from the glomerular layer of the MOB, n=3. c, Quantification of ROI depicted in (b). Quantification was performed on biological replicates consisting of c-Fos positive nuclei within the defined region from a minimum of three unilateral sections. c-Fos-positive cells were quantified by an experimenter blinded to the treatment group. The numbers from each biological replicate were then averaged across all the animals in that group (different letters indicate statistical difference by two-way ANOVA followed by Tukey post hoc). Boxes on images of brains indicate where the higher magnification images below were taken. Gr, granular layer; Gl, glomerular layer; Mi, Mitral layer. Image reproduced with permission from the Allen Institute, Image credit: Allen Institute. Scale bar, 200 μm.

