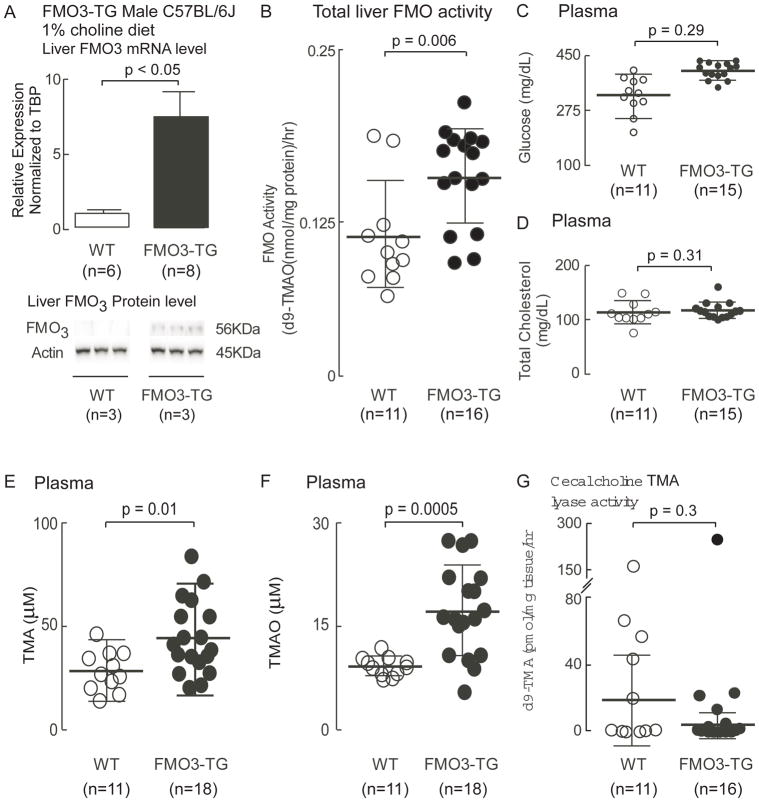
Figure 5. Characterization of mice with over expression of human fmo3 transgene.
Human FMO3-TG mice and their WT littermates were maintained on a choline-supplemented (1%) diet for 6 weeks as described under Methods. On day of study, mice were sacrificed and (A) Liver FMO3 mRNA (house-keeping gene for normalization was TBP) and protein levels (normalized by Actin) were evaluated. Shown are mean (±SEM) and Western Blot images. (B) Liver total FMO activity was quantified in liver homogenates by monitoring the conversion of d9-TMA into d9-TMAO, as described under Methods. Plasma levels of (C) glucose, (D) cholesterol, (E) TMA and (F) TMAO were also quantified as described under Methods. (G) Cecal choline TMA lyase activity was quantified by monitoring the conversion of d9-choline into d9-TMA, as described under Methods. For all plots, data reported are mean (±SEM) (middle bar and whiskers) for the indicated numbers of mice. The Wilcoxon rank-sum test was used for two-group comparison.

