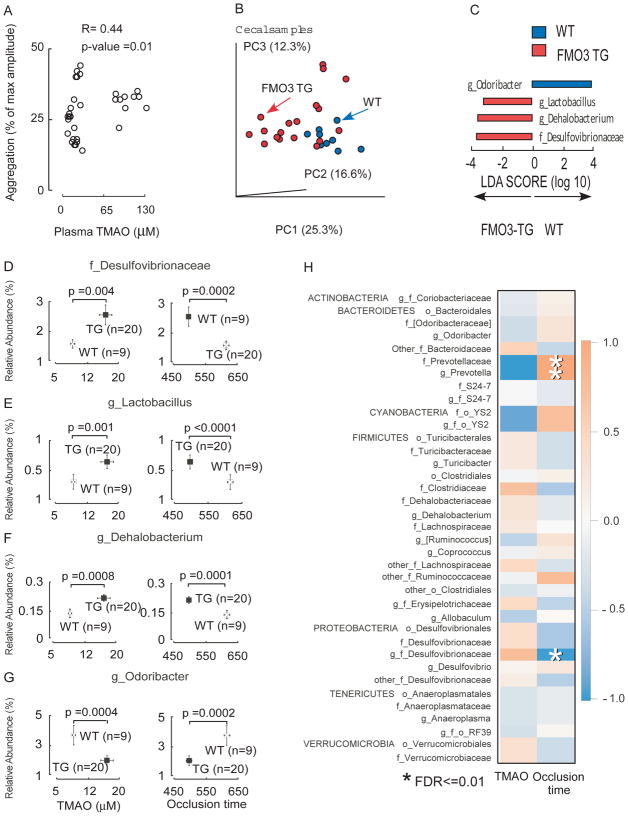
Figure 7. Microbial taxa associated with FMO3-TG-induced TMAO generation and a prothrombotic phenotype.
(A) Correlation (spearman) between plasma TMAO levels and platelet aggregation response measured in human FMO3-TG mice and their WT littermates. (B–H) Cecal microbial composition was examined by 16S analyses in human FMO3-TG mice and their WT littermates following the carotid artery FeCl3 injury model, as described under Methods. (B) Principal coordinates analyses demonstrate distinct cecal microbial composition between WT (blue) and FMO3-TG (red) groups (p<0.001 for Student’s t test with 1,000 Monte Carlo simulations). Each data point represents a sample from a distinct mouse projected onto the first three principal coordinates (percent variation explained by each PCo is shown in parentheses). (C) Linear discriminant analysis (LDA) effect size (LEfSe) analyses were performed to identify taxa most characteristic (increased abundance) in WT (blue) and FMO3-TG (red). (D–G) Taxa whose proportions are significantly associated with both plasma TMAO levels and time to cessation of blood flow (occlusion time). P-Values shown are for comparison between different groups using a robust Hotelling T2 test, with data expressed as mean (± SEM). (H) Correlation heat map showing taxa whose proportions are significantly associated with serum TMAO levels or vessel occlusion time. Red denotes a positive association, blue a negative association, and white no association. Single asterisk (*) indicates significant false discovery rate (FDR)-adjusted association of p ≤ 0.01.

