
Figure 1: IRTKS localizes to the distal tips of epithelial microvilli.
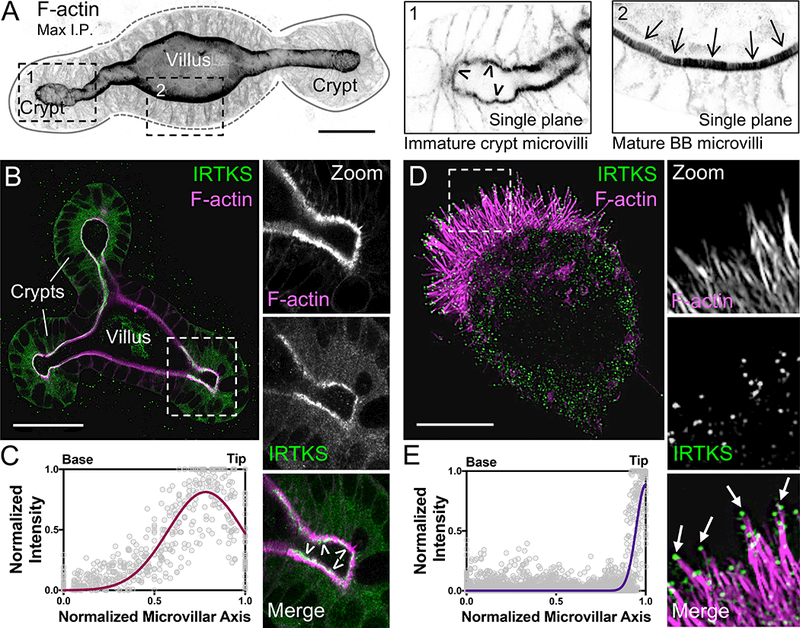
(A) Confocal maximum intensity projection of a mouse small intestinal organoid stained with phalloidin to label F-actin. Zooms indicate single plane images: 1) crypt cells, arrowheads highlight immature microvilli and 2) villar cells, arrows highlight mature microvilli. Scale bar, 25 μm. (B) Endogenous IRTKS (green) and phalloidin (magenta) labeling of an intestinal organoid. Dashed box indicates zoom of the crypt; arrowheads highlight IRTKS tip localization. Scale bar, 40 μm. (C) Line scans (n = 36 microvilli) of normalized endogenous IRTKS intensity parallel to the microvillar axis in organoid crypt domains. Length values are normalized such that 0 = base and 1 = tip. (D) SIM projection of a Ls174T-W4 (W4) cell showing endogenous IRTKS (green) and stained with phalloidin (magenta). Dashed box indicates zoom of the BB, arrows point to IRTKS puncta at the microvillar distal tips. Scale bar, 5 μm. (E) Line scans (n = 42 microvilli) of normalized endogenous IRTKS intensity parallel to the microvillar axis in W4 cells. Length values are normalized such that 0 = base and 1 = tip. See also Figure S1 and Videos S1–S3.