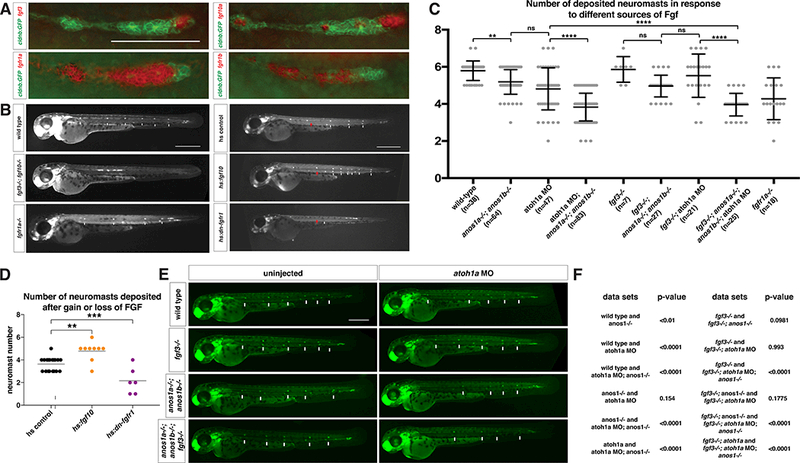
Figure 1. Fgf ligand and receptor expression and function in sensory organ formation.

(A) fgf3, fgf10a, fgfr1a, and fgfr1b mRNA expression (red) in the primordium (green) at 32 hpf. Scale bar = 100 μm.
(B) Primordium position in embryos of indicated genotypes at 50 hpf. White arrows denote deposited neuromasts, arrowheads denote position of primordium and red arrows indicate position of primordium at the beginning of the heat shock. Scale bar = 500 μm.
(C) Plot of number of neuromasts for E and B. ** = p < 0.01, **** = p < 0.0001, ns = not significant. ANOVA p<0.0001.
(D) Quantification of the number of neuromasts deposited after heat-shock in embryos of the indicated genotypes. Black lines indicate the average. Each data point is an individual embryo. ** = p < 0.01, *** = p < 0.001. ANOVA p<0.0001.
(E) Neuromast deposition (arrows) and primordium migration (arrow head) in embryos of indicated genotype at 50 hpf. Scale bar = 500 μm.
(F) Tables of unpaired t-test with Welsh’s correction for pairwise comparisons of the indicated genotypes shown in F.
