
Figure 5.
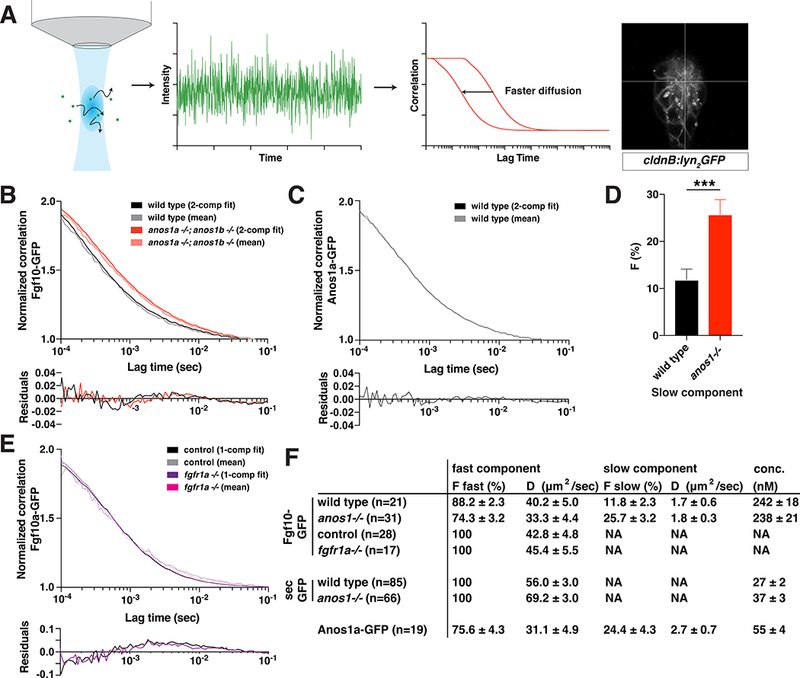
Anos1 enhances Fgf10a diffusion by increasing the pool of fast-diffusing Fgf10a molecules.
(A) Schematic of FCS measurements. Left, fluorescent molecules diffuse through a diffraction-limited spot. Arrows indicate diffusion. Middle left, fluorescence intensity fluctuations generated by molecules diffusing into and out of the confocal volume. Middle right, autocorrelation is calculated as the correlation between fluorescence intensity at time = t and time = t + τ. The X-axis represents τ, the lag time, and the Y-axis represents the correlation G(τ).Right, cross-hair indicating the position in the microlumen (white) where the FCS measurements were performed.
(B) Top, autocorrelation curves normalized to 50 μsec and 2-component fits for Fgf10a-GFP in the indicated genotypes. Bottom, residuals of the fits.
(C) Top, autocorrelation curves normalized to 50 μsec and 2-component fits for Anos1a-GFP in wild-type embryos. Bottom, residuals of the fits.
(D) Bar graph of the fraction of molecules in the slow component in the genotypes indicated. Error bars represent SD. *** = p < 0.001.
(E) Top, autocorrelation curves normalized to 50 μsec and 1-component fits for Fgf10a- GFP in the indicated genotypes. Controls include fgfr1a−/+ and wild-type sibling embryos. Bottom, residuals of the fits.
(F) Table of fitted values. F represents proportion of molecules in each component and D is the diffusion coefficient. The anos1a−/−; anos1b−/− genotype is abbreviated as anos1−/− in D and F.
See also Figure S5.