Figure 6.

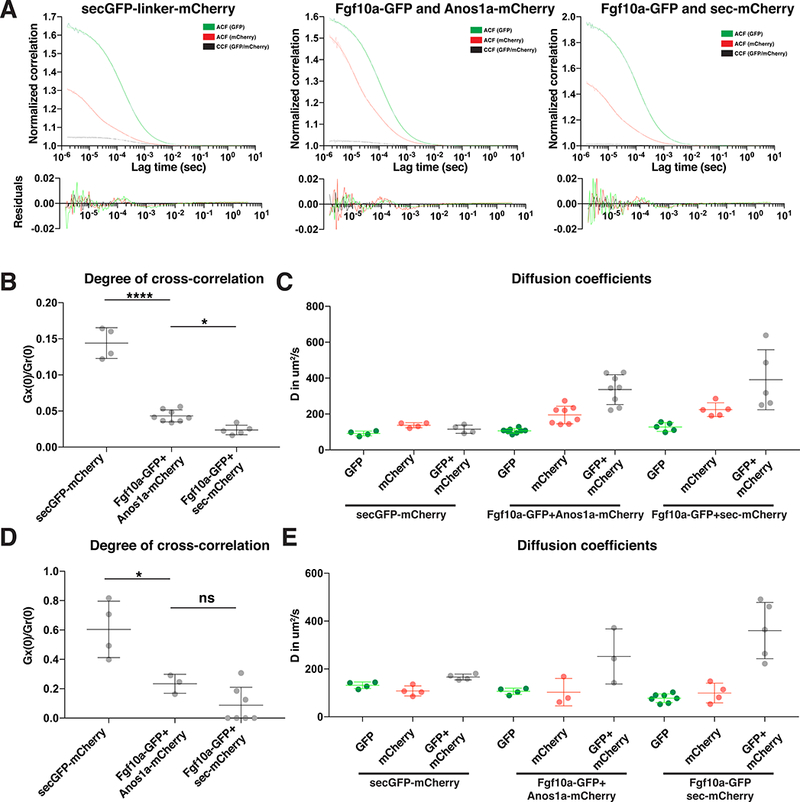
Anos1 and Fgf10a co-diffuse.
(A) Normalized autocorrelation curves and cross-correlation curves for secreted GFPmCherry dimers (left), Fgf10a-GFP and Anos1a-mCherry (middle) and Fgf10a-GFP and secreted mCherry (right) of FCCS measurements with high laser power. Bottom, residuals of the one-component fits.
(B) Plot of the degree of cross-correlations of the individual FCCS measurements for secreted GFP-mCherry dimers (left), Fgf10a-GFP and Anos1a-mCherry (middle) and Fgf10a-GFP and secreted mCherry (right) of FCCS measurements with high laser power. Mean, SD and individual data points are shown. * = p < 0.05, **** = p < 0.0001. ANOVA p<0.0001.
(C) Plot of the diffusion coefficients of the individual FCCS measurements with high laser powers for secreted GFP-mCherry dimers (left), Fgf10a-GFP and Anos1a-mCherry (middle) and Fgf10a-GFP and secreted mCherry (right). Mean, SD and individual data points are shown.
(D) Same plot as in (A) but for FCCS measurements with low laser power. Mean, SD and individual data points are shown. * = p < 0.05, ns = p > 0.05. ANOVA p=0.0002.
(E) Plot of the diffusion coefficients of the individual FCCS measurements with low laser powers for secreted GFP-mCherry dimers (left), Fgf10a-GFP and Anos1a-mCherry (middle) and Fgf10a-GFP and secreted mCherry (right). Horizontal lines indicate the average, vertical lines the SD and dots individual data points.
See also Figure S6.
