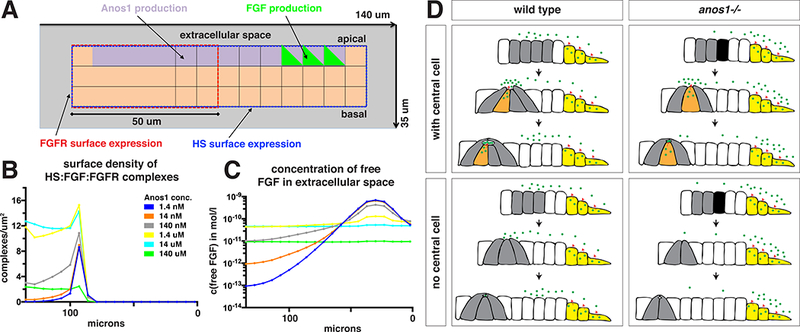
Figure 8.

Computational analysis of model for FGF shuttling by Anos1.
(A) Schematic showing a cut through the 3-dimensionally modeled primordium to indicate which cell positions express which surface receptors or secrete Anos1 or FGF.
(B) Computationally modeled density of the FGF/FGFR/HS complex on the primordium’s surface as a function of different Anos1 concentrations.
(C) Computationally modeled concentration of free FGF in the extracellular space above the apical side of the primordium as a function of different Anos1 concentrations. 0 microns indicate the front of the modeled primordium in Fig. 8A.
(D) Summary of how Anos1 affects Fgf10a ligand distribution. Black arrows indicate the progression of time. Green dots indicate Fgf10a and red arrows indicate sites of Fgf10a secretion.
See also Figure S8.
