
Figure 2. Homogeneity of FC in the Parcels.
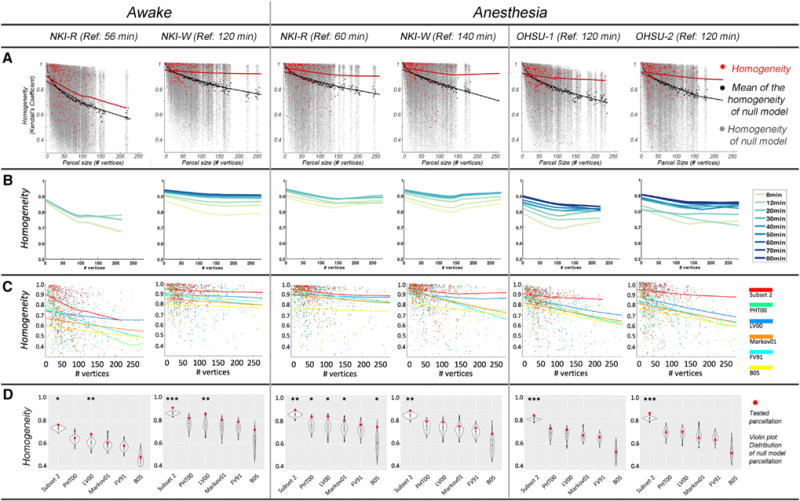
(A) Homogeneity of real parcels (red dots) by parcel size compared to homogeneity of null model parcels (gray dots) under awake and anesthesia states. The lines are the LOWESS (locally weighted scatterplot smoothing) fit represent the effect of parcel size on homogeneity of the subject parcels (red line) and the null model parcels (black line).
(B) The homogeneity of parcellations vary with the amount of test data. The LOWESS fit line plotted the homogeneity at each increment of data used in subset 1 under same condition for each macaque.
(C) The homogeneities tested in subset 1 at each of parcel size for functionally defined parcellation (red line) and five atlases.
(D) The weighted mean homogeneity across parcels of functionally defined parcellations and atlases (red dots) compared with the averaged homogeneity across parcels of each of null model (distribution of 1,000 randomization in violin plot). ***p < 0.001, **p < 0.01, and *p < 0.05 in its 1,000 null model randomizations.