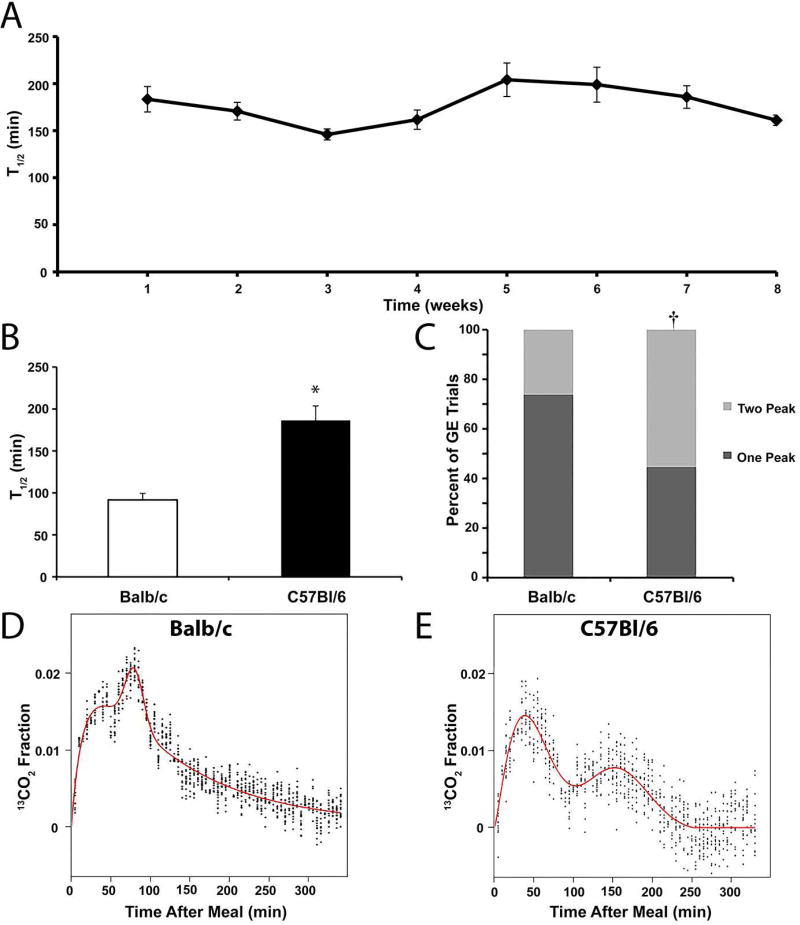
Figure 3.
Strain differences in solid gastric emptying tests between Balb/cJ and C57Bl/6J mice. A) Mean T1/2 values (± SEM) obtained for solid gastric emptying for nine C57Bl6 mice over a contiguous eight-week period shows relative stability of gastric emptying over time. B) The mean T1/2 values (± SEM) for C57Bl/6J mice (N=27 tests; closed bars) are significantly delayed compared to Balb/cJ mice (N=34 tests; open bars). *P<0.0001 T-test compared to saline. C) A greater proportion of the gastric emptying curves were better fit by the GVS2 model (light gray; 2 peak) than the GVS model (dark gray; 1 peak) in C57BL/6J mice compared to Balb/cJ mice. †P<0.05, Fishers Exact Test. Representative data from individual gastric emptying experiments that were better fit with the GVS2 model for a Balb/cJ mouse (D) and a C57BL/6J mouse (E) illustrates the qualitative differences between 2-peak curves for the two strains of mice.

