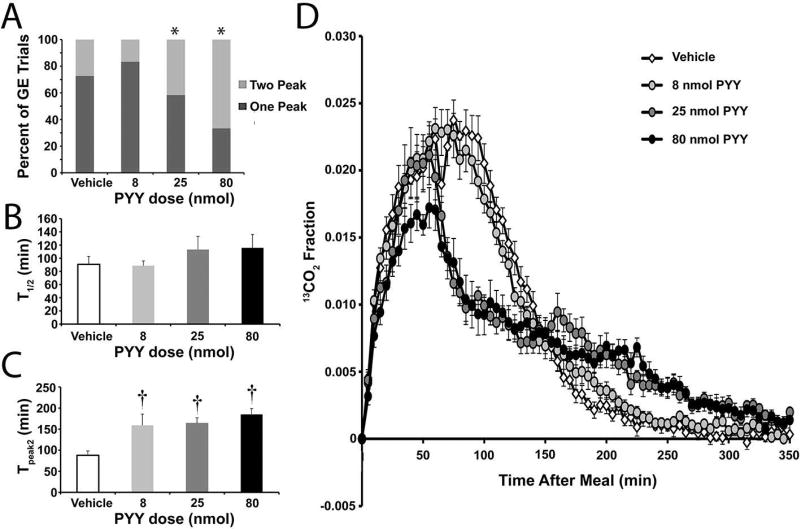
Figure 6.
Administration of PYY following egg meal ingestion increases the occurrence of two-peak gastric emptying tests, but does not alter the mean T1/2 values in Balb/c mice. A) The proportion of the gastric emptying curves better fit by the GVS2 model (light gray; 2 peak) or the GVS model (dark gray; 1 peak) in Balb/c mice treated with saline or 8nmol, 25nmol or 80nmol PYY. *P<0.05, Chi Square. B) Mean T1/2 values (± SEM) obtained for solid gastric emptying for Balb/c mice treated with saline (open bars; N=22) or 8nmol (light gray bars; N=24), 25nmol (dark gray bars; N=12) or 80nmol (closed bars; N=12) PYY. P>0.05 ANOVA. C) Mean Tpeak2 values (± SEM) obtained for solid gastric emptying for Balb/c mice treated with saline (open bars; N=6) or 8nmol (light gray bars; N=4), 25nmol (dark gray bars; N=5) or 80nmol (closed bars; N=8) PYY where the GVS2 model was the better fit. †P<0.05 ANOVA with Neuman Keuls Multiple Comparisons Test compared to saline-treated controls. D) The mean molar percent of 13C (± SEM; N=11) for each average five-minute time point plotted over time generates average solid gastric emptying curves for Balb/c mice treated with saline (open symbols) or 8nmol (light gray symbols), 25nmol (dark gray symbols) or 80nmol (closed symbols) PYY. P<0.0001 2-way ANOVA. The text describes the time points at which there was a significant difference between treatment groups.

