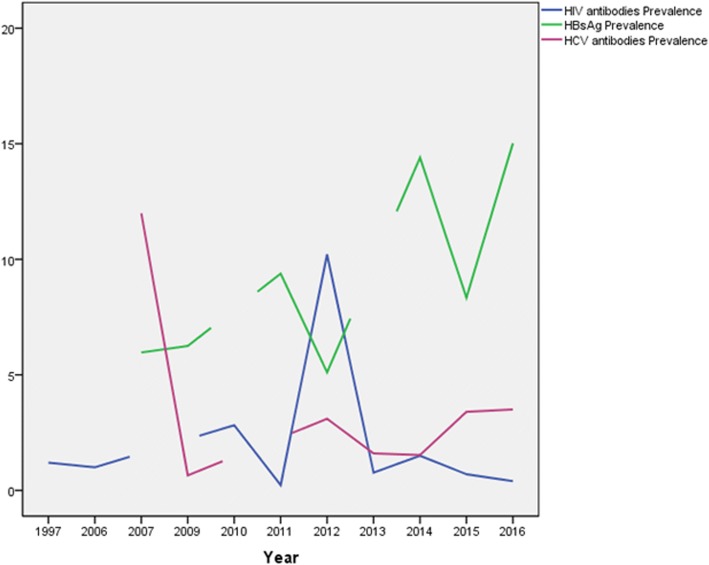
Fig. 8.
Prevalence rates of the three infections according to publication period of all studies included in the review. Data was plotted as line graphs, when there is no published study in a given year; the line predicts the direction to be in accordance to the next year with published study/ies and get disrupted to indicate a missing data

