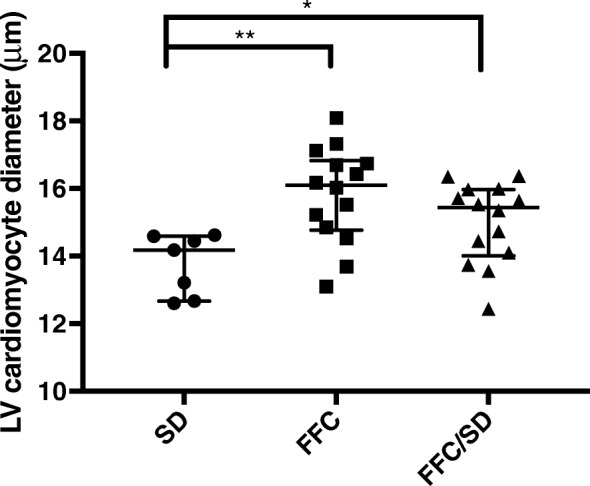
Fig. 6.

Left ventricular cardiomyocyte diameter. Left ventricular cardiomyocyte diameter assessed on hematoxylin and eosin stained sections. SD = fed standard chow, FFC = fed fat/fructose/cholesterol-rich diet, FFC/SD = dietary normalization. Black bars in graph represent median and interquartile range (25th–75th). * = P < 0.05, ** = P < 0.01
