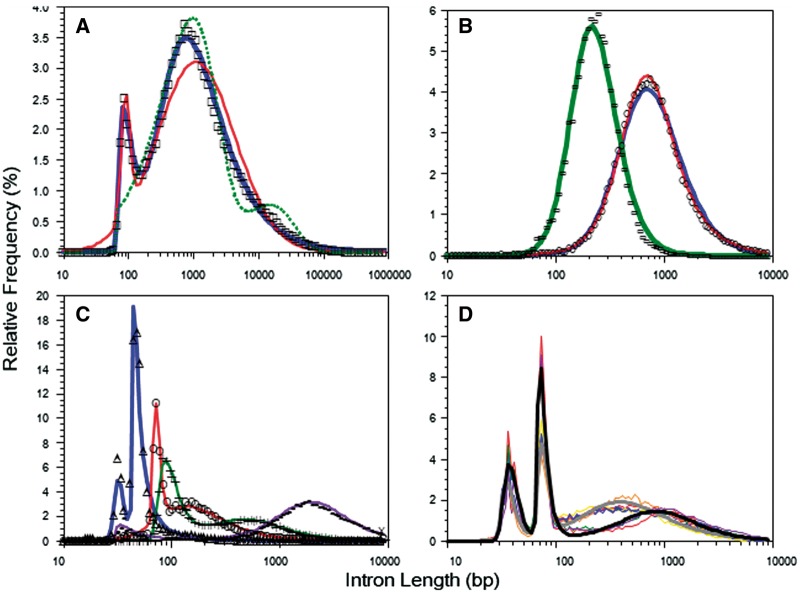
Fig. 1.
Variety of observed ILDs (symbols) and their statistical models (lines). (A) Chicken ILD. Thick line: Frechet model, thin line: log-normal model, dotted line: geometric model. (B) Single modal ILDs. Left: Chlamydomonas reinhardtii (green alga), right Ascaris suum (nematode); thin line: one-component model, thick line: two-component model. (C) Dual modal ILDs. Triangle: Dioszegia cryoxerica (fungus), circle: Emiliania huxleyi (protist), plus sign: Oryza brachyantha (plant), dot: Schistosoma haematobium (animal). (D) Triple modal ILDs of tapeworms. Black thick line: ensemble model of three Hymenolepis members, gray thick line: ensemble model of six Taeniidae plus one Mesocestoididae members. Thin lines represent individual experimental ILDs. All statistical models in B–D are Frechet models. ILDs in panels (C) and (D) are reproduced in separate panels in Supplementary Figure S2 (Color version of this figure is available at Bioinformatics online.)

