
Fig. 1.
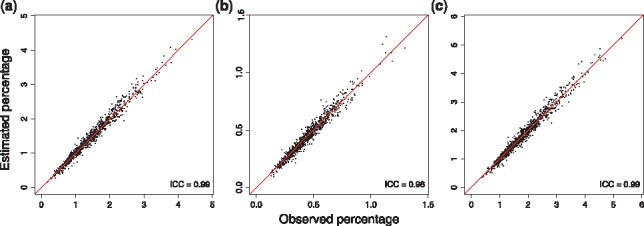
Percentage of phenotypic variance explained using summary statistics (estimated) and individual-level data (observed) for (a) main genetic (b) interaction and (c) joint effects. The line corresponds to y=x and ICC is the intraclass correlation coefficient