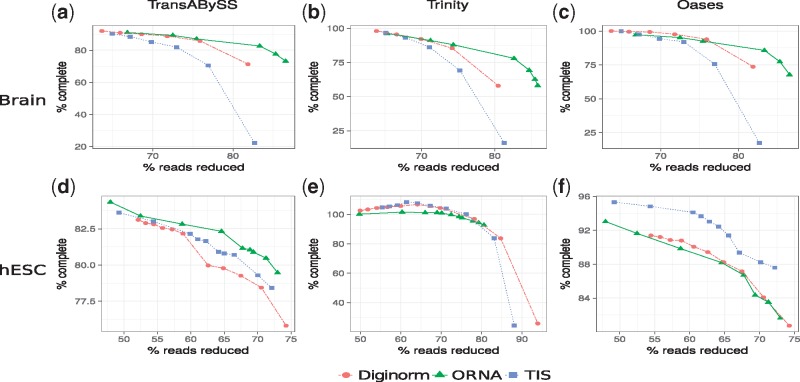
Fig. 3.
Comparison of assemblies generated from ORNA, Diginorm and TIS reduced datasets. Each point on a line corresponds to a different parametrization of the algorithms. The amount of data reduction (x-axis) is compared against the assembly performance measured as % of complete (y-axis, see text). (a) and (d) Represent TransABySS assemblies (k = 21) applied on normalized brain and hESC data, respectively. (b) and (e) Represent Trinity assemblies (k = 25) and (c) and (f) represent Oases multi-kmer assemblies applied on normalized brain and hESC data, respectively

