
Fig. 3.
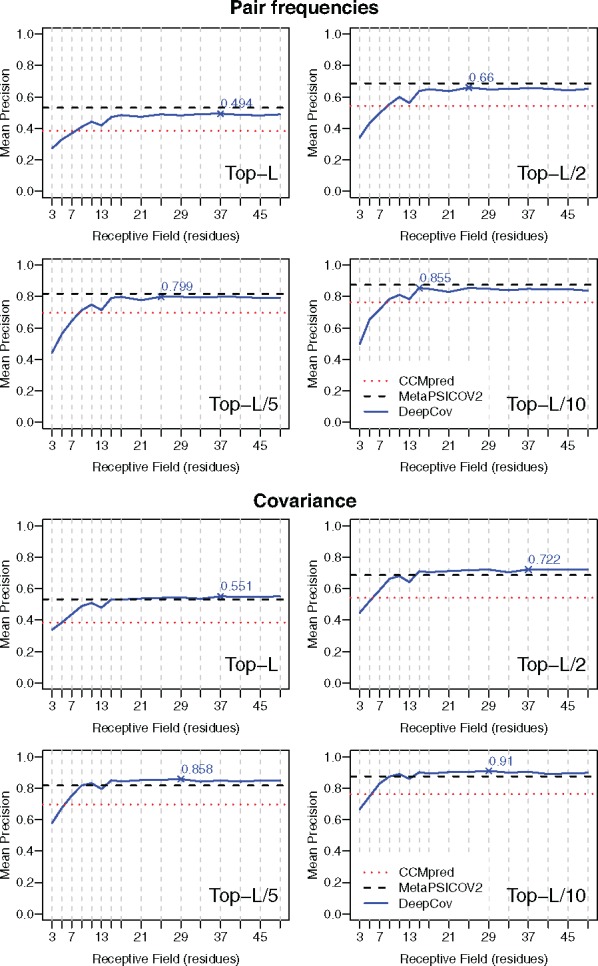
Mean long-range contact precision achieved by DeepCov on the PSICOV150 dataset using various receptive field sizes (see Table 1), using pair frequency (top 4 plots) and covariance data (bottom 4 plots). Data for DeepCov are plotted as solid lines for top-L, L/2, L/5 and L/10 predicted contacts. For DeepCov data, the maximum observed mean precision is marked. Dashed lines represent the mean precision achieved by CCMpred (dotted horizontal lines) and MetaPSICOV2 (dashed horizontal lines) respectively on the same dataset. Using covariance data, DeepCov achieves greater mean precision than CCMpred and MetaPSICOV2 when receptive field sizes of around 15 residues or more are used