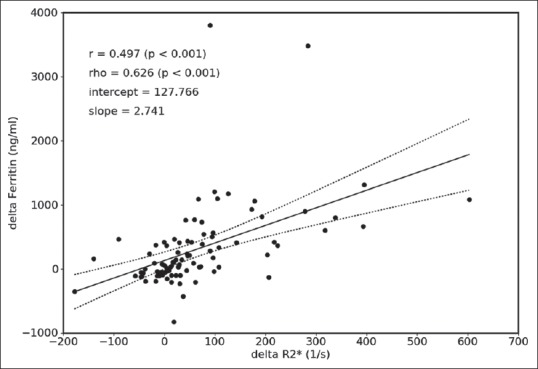
Figure 2.

Correlation between absolute changes of pathological liver R2* values and ferritin changes. Only pairs of consecutive examinations and only patients with R2* >70 1/s at their first examination were considered. The solid line represents the best linear fit to the data; the dotted lines correspond to the 95% confidence interval of the linear regression. Negative values represent an increase of the respective value between examinations.
