Fig. 5.

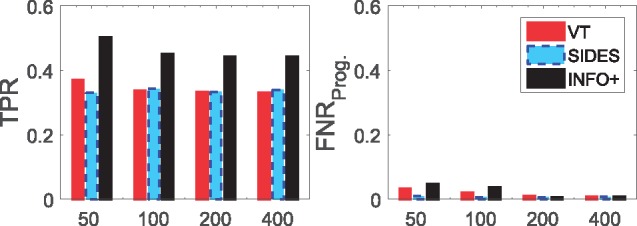
Comparing VT/SIDES/INFO+ for problems with different dimensionalities. This is the average TPR/ over 200 simulated datasets from M-6 various dimensionalities p. We simulated the data with predictive strength θ = 5 and sample size n = 2000

Comparing VT/SIDES/INFO+ for problems with different dimensionalities. This is the average TPR/ over 200 simulated datasets from M-6 various dimensionalities p. We simulated the data with predictive strength θ = 5 and sample size n = 2000