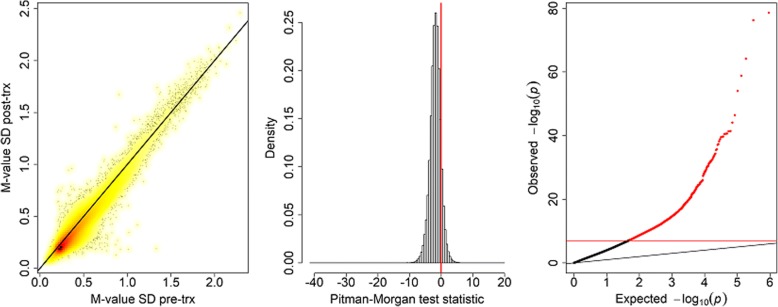
Fig. 3.
Density scatterplot of the standard deviations of the M-values pre- and post-treatment (first panel), a histogram of the test statistic for equality of variances (second panel), and a quantile-quantile plot of the −log10 (p values) (third panel) with the Bonferroni-corrected significance level as a horizontal red line. The black diagonal line in the first and third panels is x = y

