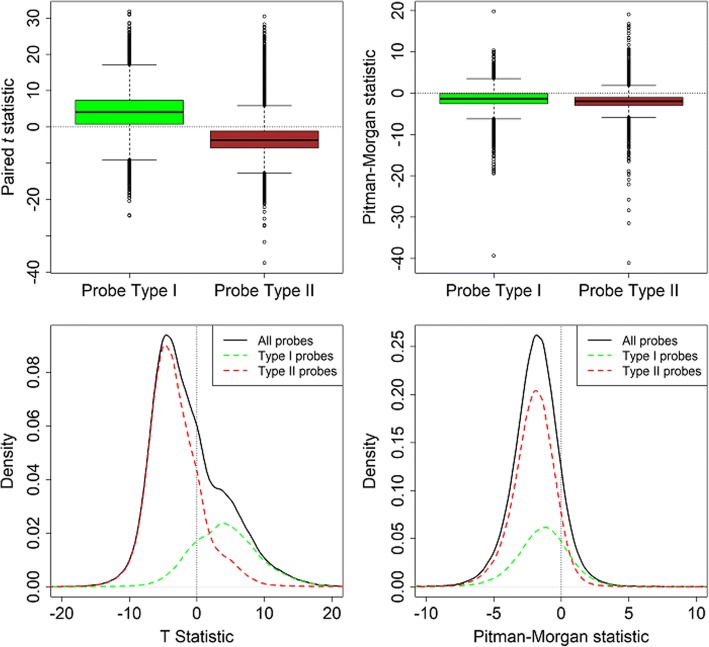
Fig. 4.
Boxplots of the two test statistics used stratified by probe type. Top row: Boxplots of the paired t (left panel) and Pitman-Morgan (right panel) test statistics stratified by Infinium probe type. Bottom row: Scaled kernel density estimates of the paired t (left panel) and Pitman-Morgan statistics (right panel) for all probes and stratified by probe type

