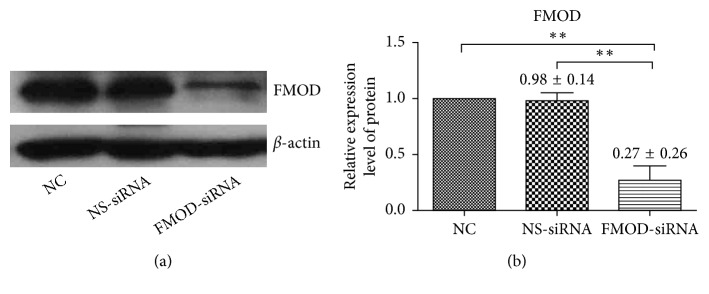
Figure 1.
Expression of FMOD in RPE cells. FMOD expression in human RPE cells was significantly knocked down in FMOD-siRNA-treated group at the protein level, as measured by western blot 48 h after transfection. There is no significant difference in normal control (NC) and nonsilencing siRNA-treated (NS-siRNA) RPE cells. The expression of FMOD in NC group was set to 100%: (a) representative blot images; (b) statistical analysis of FMOD expression. Data are represented as the means ± SEM of fold changes compared to the controls. Each experiment was repeated at least three times. ∗∗P < 0.01.

