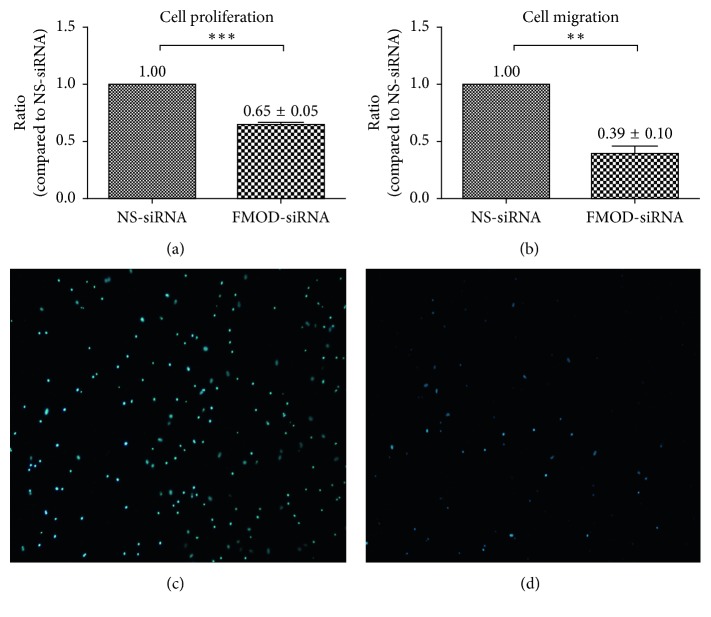
Figure 2.
Effects of FMOD on proliferation and migration in RPE cells. The results of the CCK-8 proliferation assay revealed that FMOD-siRNA-treated RPE cells displayed decreased proliferation compared with the control group: (a) statistical analysis of CCK-8 proliferation assay; statistical analysis of the Boyden Chamber assay revealed that the number of cells that passed through the membrane in the FMOD-siRNA group was significantly lower than the number in the control group: (b) statistical analysis of Boyden Chamber assay; (c) NS-siRNA-treated RPE cells; and (d) FMOD-siRNA-treated RPE cells. Data are presented as the means ± SEM. Each experiment was repeated at least three times. ∗∗P < 0.01; ∗∗∗P < 0.001.

