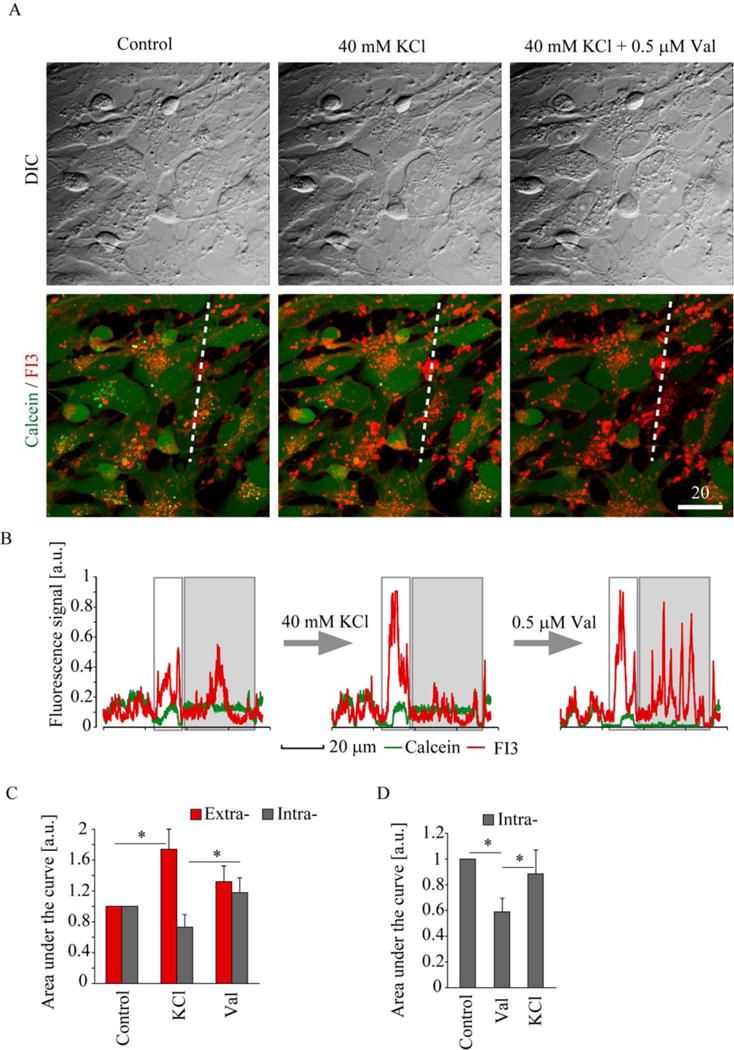
Figure 5. Monitoring of extra- and intracellular K+ in neural cells with FI3 nanoparticles.

The live rat primary neural cells were stained with nanoparticles (10 μg/ml, 16 h), counter-stained with Calcein Green and treated with KCl and valinomycin (Val). A: Representative transmission light (DIC) and superimposed confocal fluorescence images of FI3 and Calcein before and after treatment with KCl (40 mM) and valinomycin (Val, 0.5 μM). B-C: Line profile analysis of the changes in FI3 and Calcein fluorescence signals, induced by treatments in (A). The areas of intra- and extracellular FI3 pools are highlighted in (B) in grey and white, respectively. D. Results of line profile analysis of the changes in intracellular FI3 signal, induced by the sequential addition of Val and KCl. Images (A) represent stacks of 2 confocal planes taken with 0.5 μm step. Error bars indicate SEM. Asterisks indicate significant difference (p < 0.01, U test). N = 4 (D). Scale bar is in μm.
