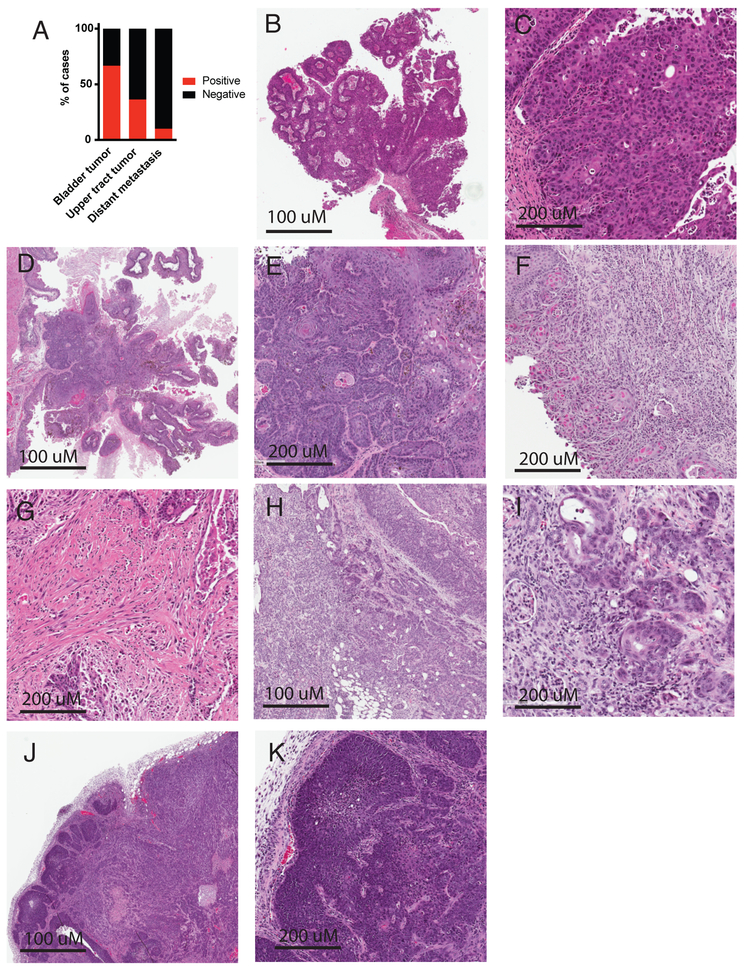
Figure 2. Representative histology of UPPL tumors.
A) Bar graph indicating the percentage of UPPL mice that developed bladder tumors, upper tract tumors, and distant metastases at the time of sacrifice. B) low power view of papillary appearing UPPL tumor. C) High power view of papillary UPPL tumor. D) Low power view of papillary tumor with squamous histology. E) High power view of squamous histology. F) UPPL tumor showing lamina propria invasion. G) UPPL tumor with muscularis propria invasion. H) Upper tract tumor demonstrating invasion into the renal parenchyma. I) High power view of urothelial tumor invading renal parenchyma. J) Cervical lymph node metastases. K) High power view of cervical lymph node metastases.

