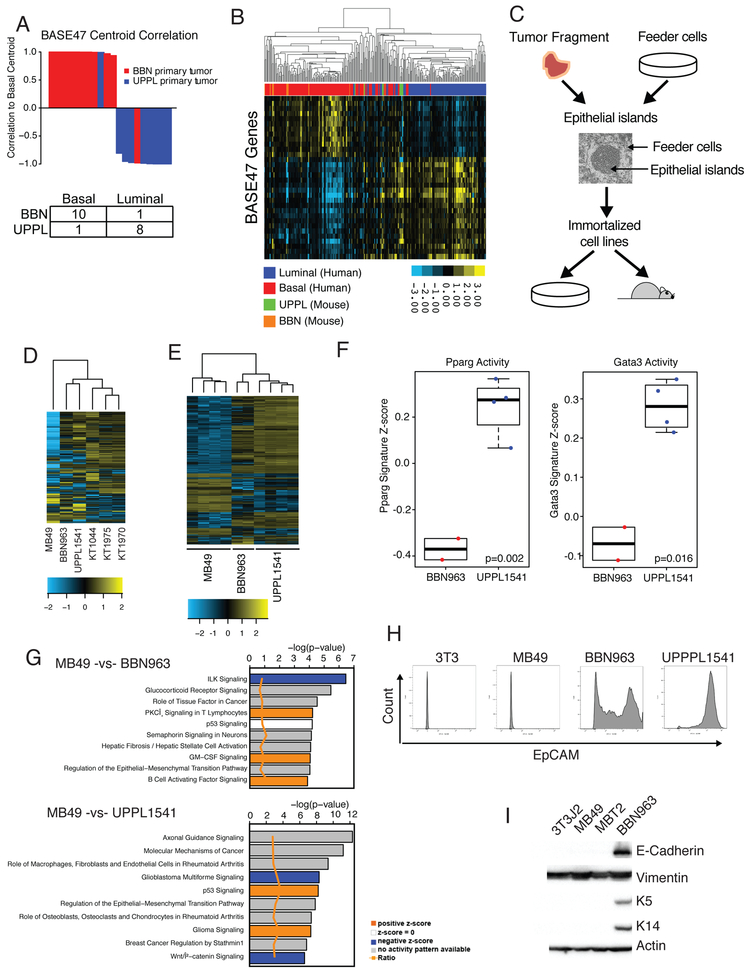
Figure 3. BBN and UPPL tumors recapitulate the human basal and luminal molecular subtypes of bladder cancer.
A) Waterfall plot of the correlation to the Basal centroid for BBN and UPPL primary tumors, with an accompanying confusion matrix indicating the subtype calls. B) Unsupervised clustering heatmap of BBN and UPPL primary tumor samples with the TCGA BLCA dataset across genes in the BASE47 classifier. C) Representative flowchart of the workflow to transition a primary tumor extracted from a mouse model to a cell line and a cell line derived tumor. D) Unsupervised clustering heatmap of MB49, BBN963, UPPL1541 and normal urothelium (KT) cell lines across the top 10% most differentially expressed genes across the samples. E) Unsupervised clustering heatmap of MB49, BBN963, and UPPL1541 cell line derived tumors across the top10% most differentially expressed genes across the samples. F) Box plots of Pparg and Gata3 gene signature scores from RNAseq data of BBN963 and UPPL1541 cell line derived tumors. G) IPA Analysis plots showing activated pathways in MB49 cell line derived tumors relative to BBN963 and UPPL1541 cell line derived tumors H) Flow Cytometry plot for EpCAM expression in 3T3, MB49, UPPL1541, and BBN963 cell lines I) Western blot of whole cell lysates from 3T3, MB49, MBT2, and BBN963 cell lines blotted for the indicated antibodies.

