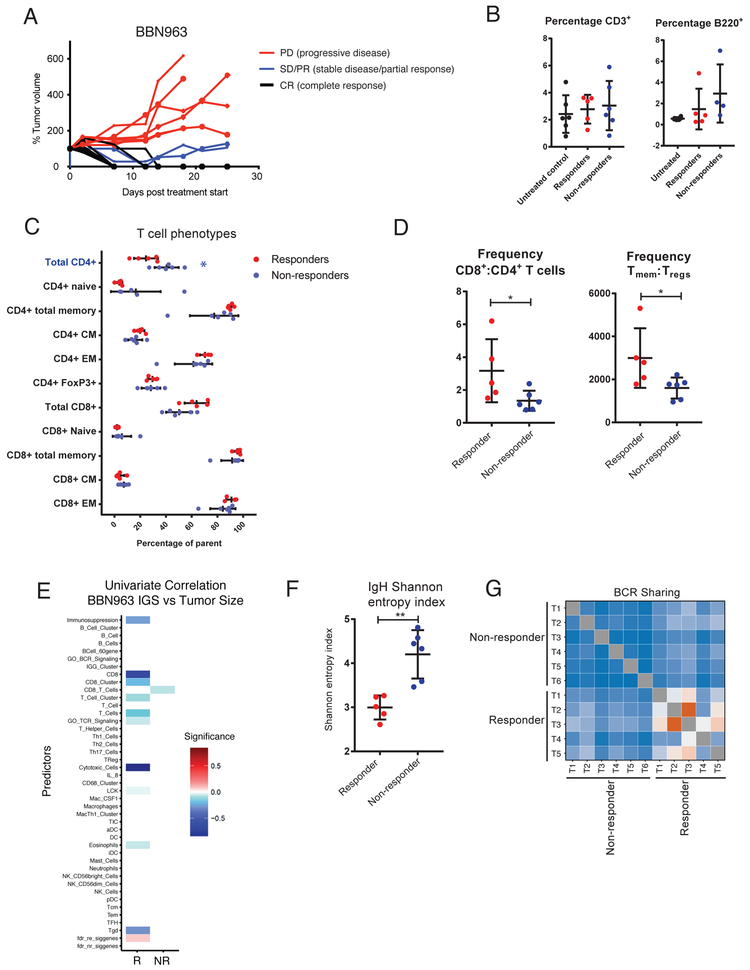
Figure 6. Description and immune characterization of BBN963 mixed-response phenotype.
A) Tumor growth curves of anti-Pd-1 treated, cell line derived BBN963 tumors, showing responders (black) and non-responders (red) to therapy. B) Flow characterization of tumor infiltrating T cells (CD3+) and B cells (B220+) in untreated (black), responder (red), and non-responder (blue) BBN963 tumors. C) T cell phenotypic subpopulations in cell line derived BBN963 and UPPL1541 tumors, with significantly increased phenotypes highlighted with respective colors (Mann-Whitney U-test, *: p < 0.05). D) Frequency of memory to regulatory T cells (CD3+CD44+: CD3+CD4+FoxP3+) and CD8+ to CD4+ T cells in responder versus non-responder BBN963 tumors. E) Univariable correlation of tumor size to immune gene signature expression in responder (left) and non-responder (right) BBN963 tumors. Shannon entropy index F) and receptor clonotype sharing G) of tumor infiltrating B cell receptor heavy chain expression in responder and non-responder BBN963 tumors.

