
Fig. 1.
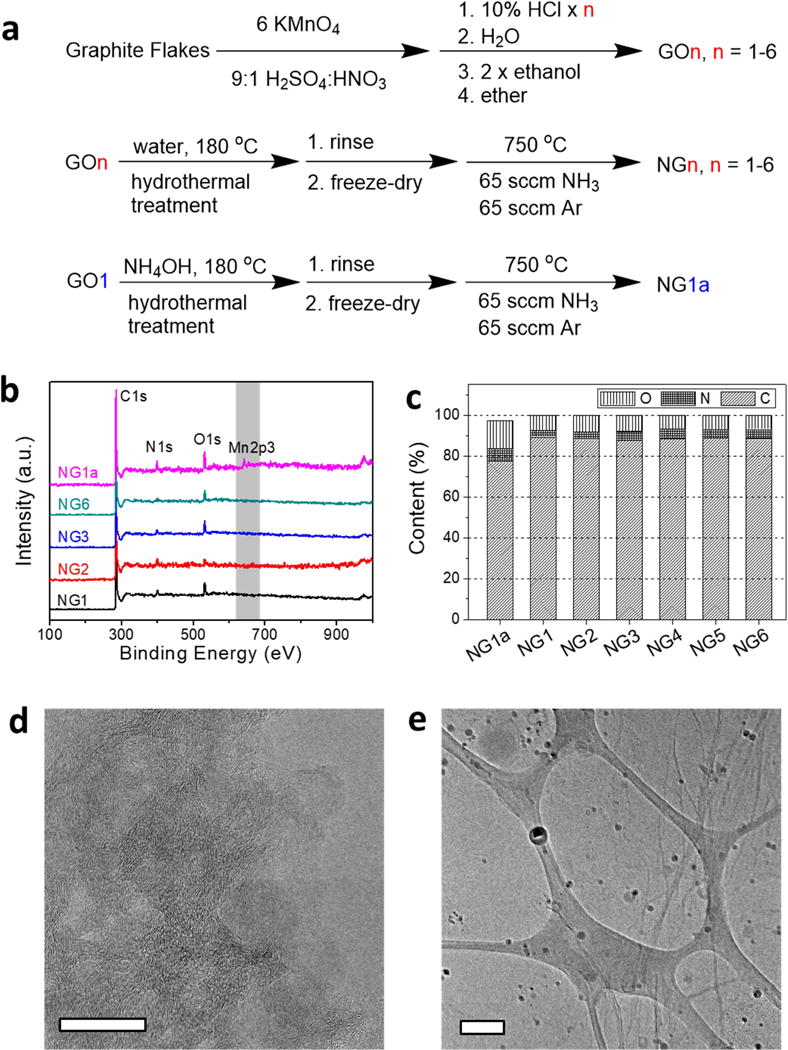
Synthesis of materials and characterization by XPS and TEM. (a) Reaction scheme for the synthesis of NGn and NG1a. (b) XPS survey spectra of NGn and NG1a. (c) Atomic concentrations of C, N, O determined by XPS. No apparent Mn signal is detected by XPS in NGn, (n = 1-6). The Mn content in NG1a is ~ 2.5 at%. (d) TEM image of NG1 with no apparent nanoparticles on the graphene surface. The scale bar is 20 nm. (e) TEM image of NG1a on a lacey carbon grid with ~5 nm diameter nanoparticles distributed on graphene. The scale bar is 200 nm.