
Fig. 8.
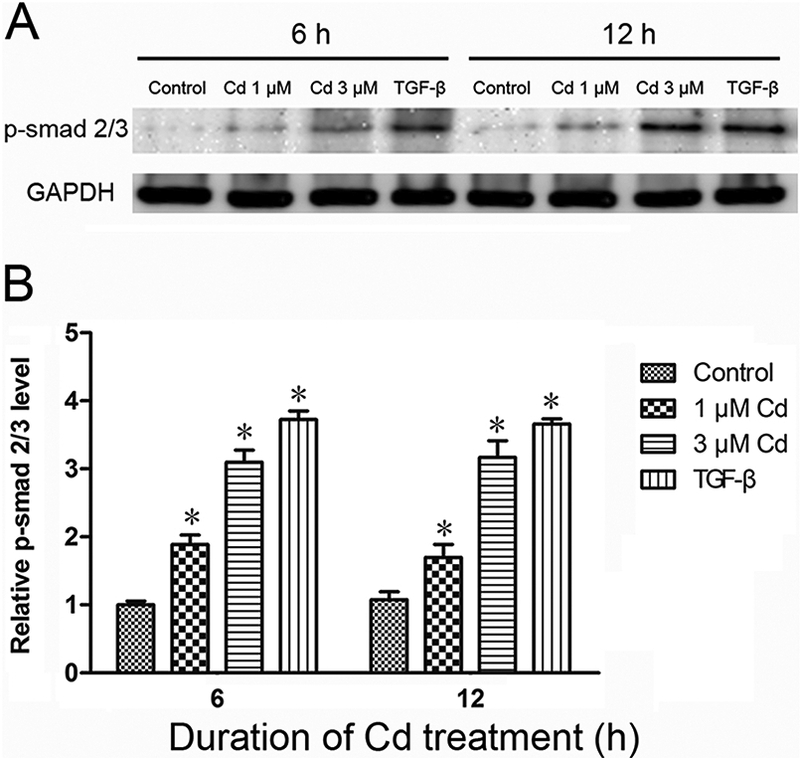
Activation of Smad 2/3 by Cd. The cells were treated with 1 and 3 μΜ Cd and p-Smad 2/3 was analyzed in cell extracts after 6 and 12 h. TGF-ß was used as a positive control. (A) Representative Western blot of p-Smad 2/3, and (B) Relative p-Smad levels. Density relative to the control is expressed as mean±SE (n = 3). *Significantly different from the respective control. (p < 0.05).