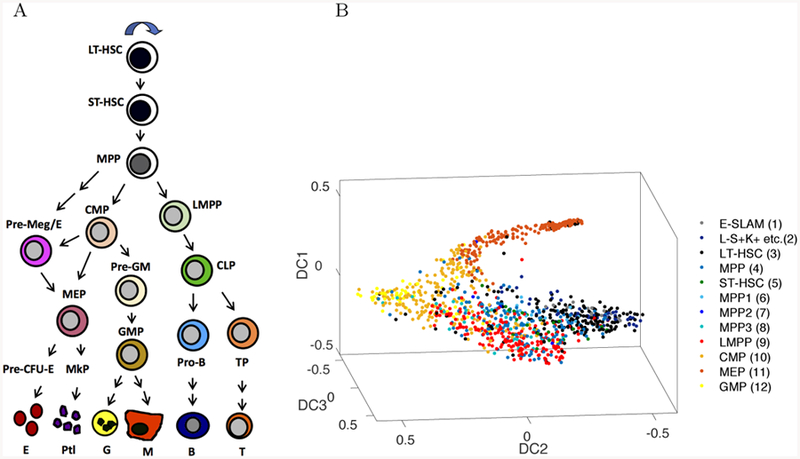
Figure 1.

A) Classic representation of a linear hierarchy of discrete cell states, from long-term hematopoietic stem cell (LT-HSC), short-term (ST)-HSC, multipotent progenitor (MPP) to committed common myeloid progenitor (CMP), pre-megakaryocyte/erythrocyte (Pre-Meg/E) and megakaryocyte-erythroid progenitor (MEP),pre-granulocyte/macrophage (Pre-GM), granulocyte-macrophage progenitor (GMP), and lymphoid primed-MPP (LMPP), common lymphoid progenitor (CLP) cells, on down to terminally differentiated cells such as erythrocytes (E) platelets (Plt), granulocytes (G) macrophages (M), B and T cells. B) The classical view is contrasted with a nonlinear continuum representation of hematopoietic cell differentiation states using diffusion map dimension reduction of scRNA-Seq data (figure recreated from data available in Nestorowa et al. (2016a)). Colors representing cell identities in A) and B) are coordinated. Cell types in B) are a subset of cells represented in A).
