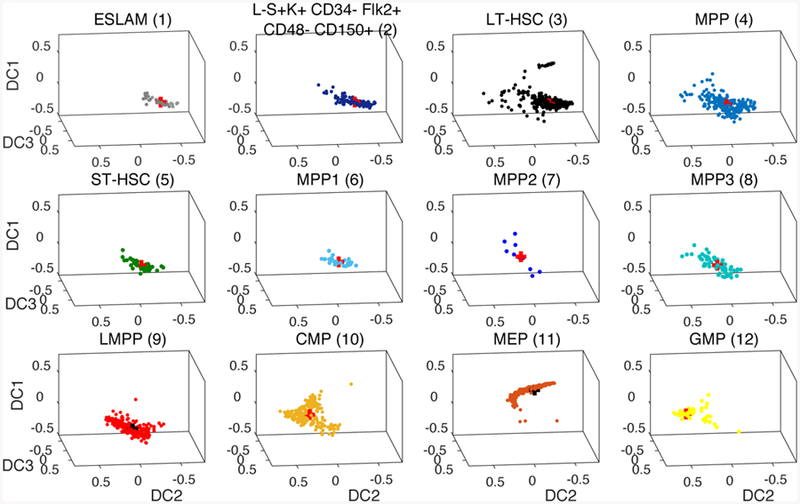
Figure B2.

The cell data from (Nestorowa et al. 2016a) is grouped into 12 cell nodes according to 12 commonly sorted HSPC phenotypes including LT-HSC, ST-HSC, and MEP. The center of mass of each cluster is marked as a red cross and used to establish nodes and edges on the graph which is then used as a computational domain for our simulations.
