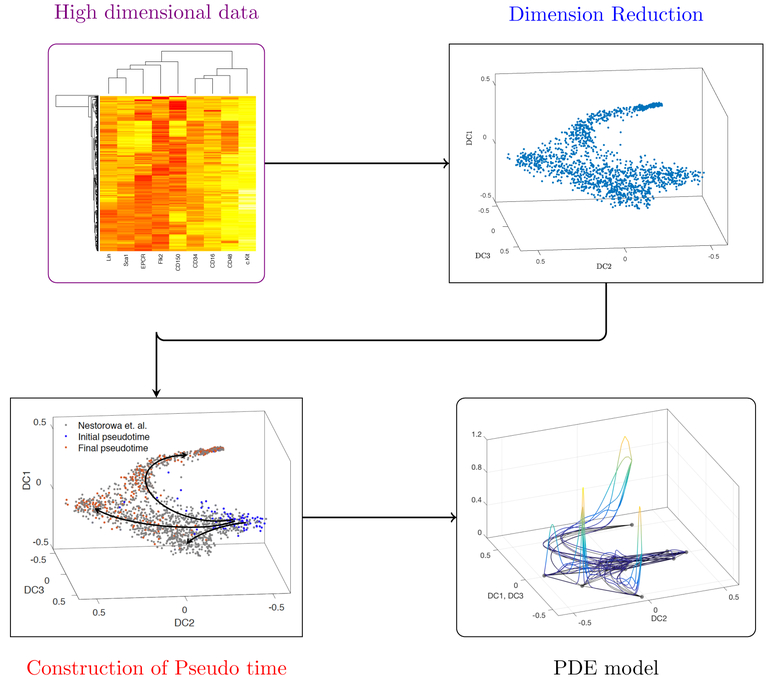
Figure 2.
Flow chart of our modeling process: This chart organizes the steps taken toward constructing the PDE model. First, high-dimensional data such as single cell RNA-Sequencing (scRNA-Seq) are represented in 2- or 3-dimensional space through one of many dimension reduction techniques. Then, temporal events (pseudotime trajectories) are inferred from the dimension reduced reduced data. We then use the reduced dimension representation and pseudotime trajectories to model flow and transport in the reduced space. In Section 2, we summarize dimension reduction techniques and reconstructing pseudotime trajectories. In Section 4 we show the results of our modeling. Data is from Nestorowa et al. (2016a).

