
Figure 3.
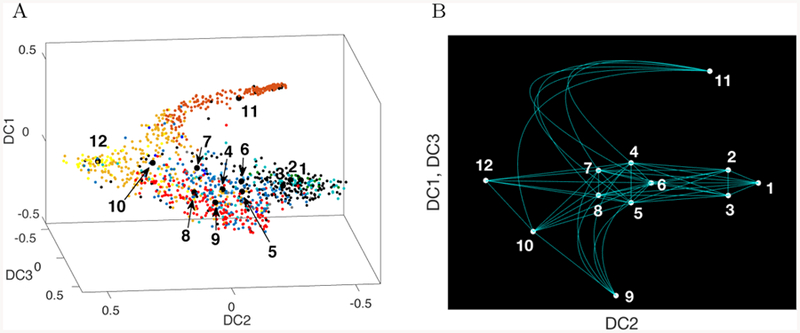
A) For the 12 cell types idenfied in Nestorowa et al. (2016a), the center of mass of each cell type is used to define a node on an abstracted graph B). Edges between nodes are constructed based on inferred trajectories on the graph based on diffusion pseudotimes starting from nodes 1, 2, and 3, to nodes 4–8, then to the progenitor nodes 9–12. The graph represents a continuum of cell states (edges) that includes identification of canonical cell states along the continuum (nodes 1–12) (Table 1).