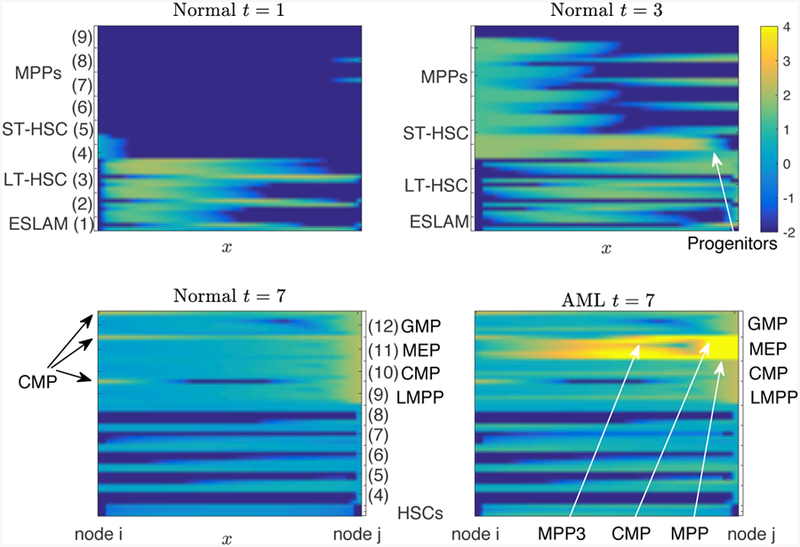
Figure 9.

The continuum of cell states can be visualized as the density of cells along the 51 edges of the graph (rows) connecting node i (left) to node j (right) for all nodes i, j. Cell distribution (log10 scale) on the edge comparing the normal condition and AML. In addition to an accumulation of MEP cells, novel intermediate cell states emerge resulting from the differentiation block and increased proliferation rate resulting from AML. These novel cell states are indicated with white arrows and generally fall between the CMP, MPP, and MEP canonical cell states. The presented edges in the first row (t < 4) are lexicographically ordered with respect to the left end (an) to visualize which nodes are the differentiating cells departing from and with respect to the right end (bn) in the second row (t > 4) to visualize which nodes are the arriving cells differentiated into.
