FIGURE 2.
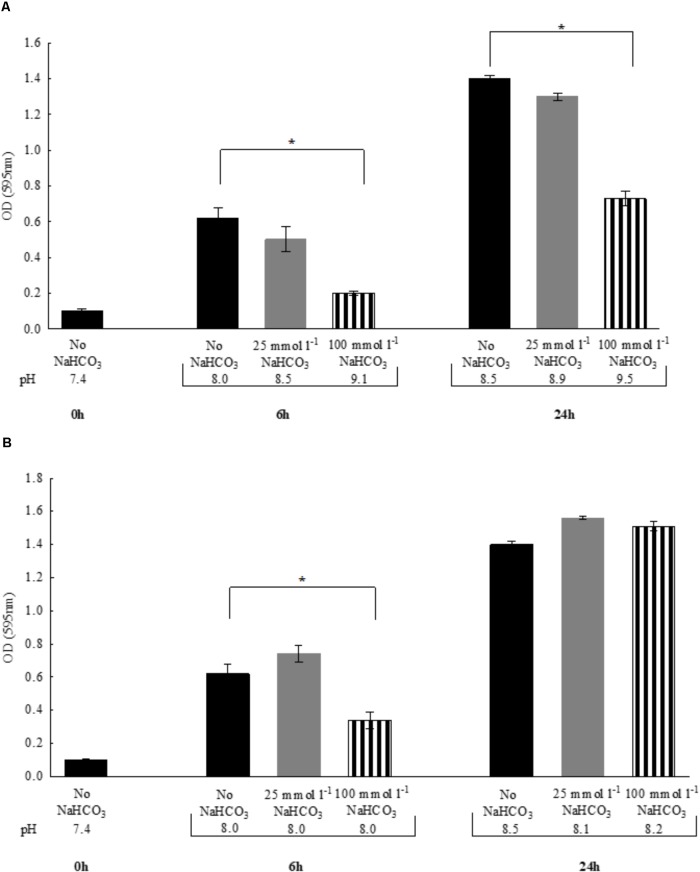
Changes in bacterial density of Pseudomonas aeruginosa and media pH following 6 vs. 24 h incubations either (A) in air atmosphere, or (B) in the presence of appropriate levels of CO2. Black bars: NaHCO3-free controls, gray bars: 25 mmol l-1 NaHCO3; striped bars: 100 mmol l-1 NaHCO3. Statistically significant, ∗P < 0.05.

