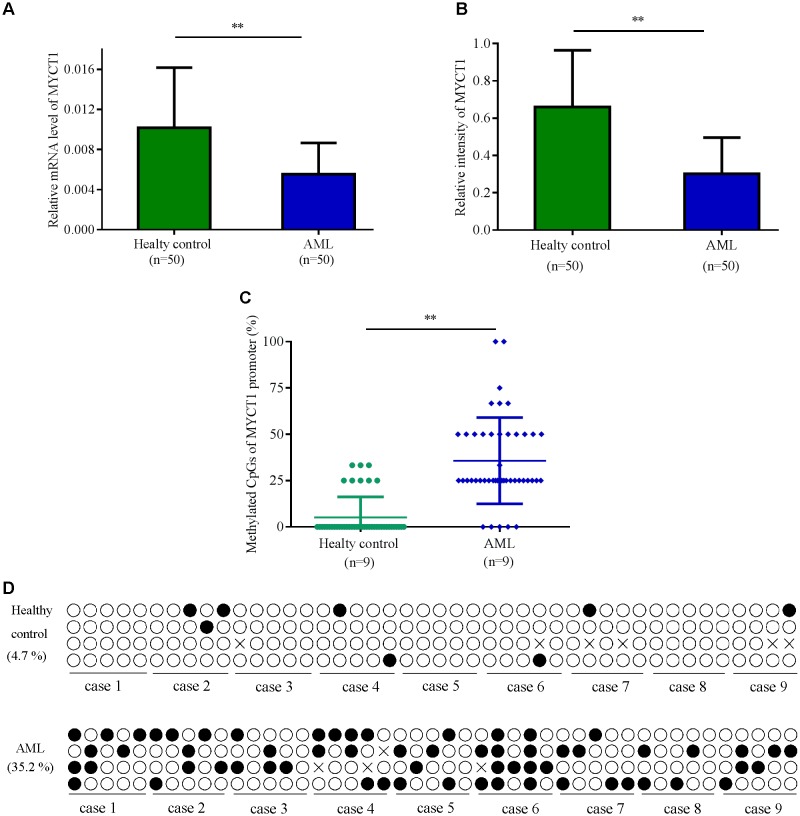
FIGURE 1.
The expression levels of MYCT1 in BM of AML patients and Healthy controls. Relative mRNA (A) and protein (B) levels of MYCT1 in the BM of AML patients and healthy controls were tested by RT-PCR and Western blot analysis, respectively (n = 50). (C) Methylation density of MYCT1 gene in AML patients and Healthy controls as analyzed by BSP (n = 9); (D) Methylation status of the specific promoter region of the MYCT1 gene. Each line of circles indicated the sequence of an individual clone; ∘ represented an unmethylated CpG site and ∙ represented a methylated CpG site. ∗∗P < 0.01 versus healthy group and BM, bone marrow.

