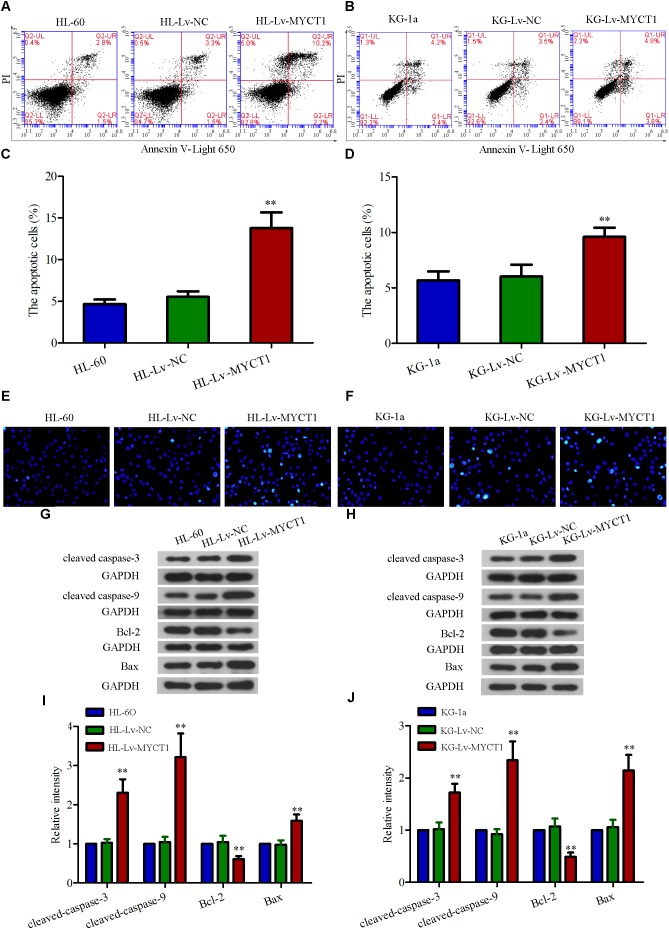
FIGURE 4.
Overexpression of MYCT1 induces apoptosis in HL-60 and KG-1a cells. (A,B) The apoptotic cells were detected by FACS analysis after staining with PI/Annexin V-Light 650, and the apoptosis rates were shown in parts (C,D) (apoptotic cell fraction = UR + LR). UR quadrant represents Annexin V and PI positive staining cells (apoptotic cells), while LR quadrant represents Annexin V positive and PI negative staining cells (early apoptotic cells). (E,F) Apoptosis, as induced by overexpression of MYCT1 in HL-60 (E) and KG-1a (F) cells, was determined by Hoechst staining. ∗∗P < 0.01 versus HL-Lv-NC or KG-Lv-NC cells. Scale bar: 50 μm. (G,H) The levels of apoptosis-related proteins, including cleaved caspase-3, cleaved caspase-9, Bcl-2 and Bax were assessed by Western blot analysis. (I,J) Quantitative analysis of the gray intensity values. ∗∗P < 0.01 versus HL-Lv-NC or KG-Lv-NC cells. UR, Upper right and LR, Lower right.

