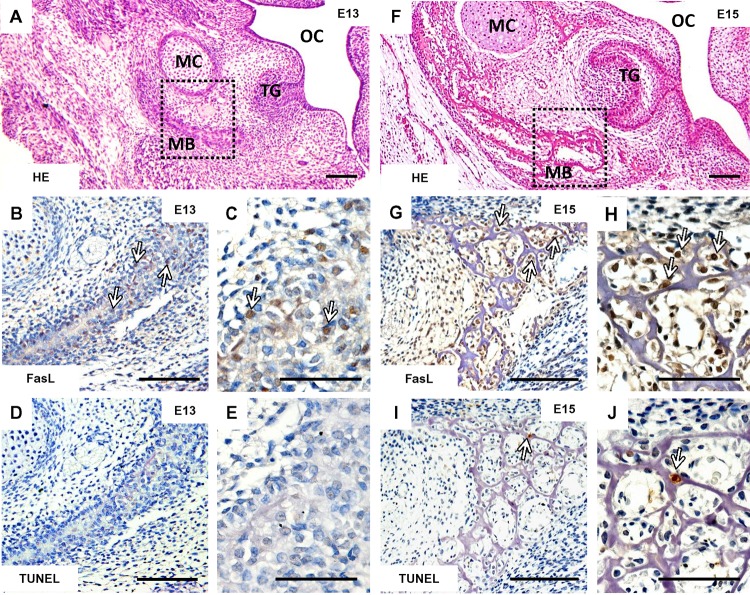
FIGURE 1.
Temporo-spatial analysis of FasL expression and apoptosis. Morphology of the mandible visualized by haematoxylin-eosin staining at E13 (A) and E15 (F), immunohistochemical detection of FasL expression in the mandibular bone at E13 (B,C) and E15 (G,H), localization of apoptotic cells (TUNEL) in the mandibular bone at E13 (D,E) and E15 (I,J). Arrows point to the positive cells (immunohistochemistry-brown). Mandibular bone (MB), Meckel’s cartilage (MC), tooth germ (TG), oral cavity (OC). Scale bar = 100 μm (A,B,D,F,G,I), scale bar = 50 μm (C,E,H,J).

