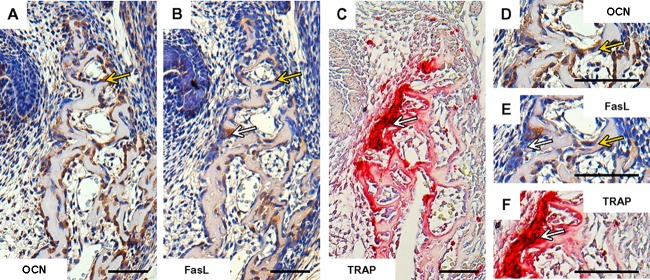
FIGURE 2.
Correlation of FasL expression with markers of bone cells in prenatal (E15) mandibular bone. Distribution of osteocalcin-positive cells/osteoblasts (A,D), localization of FasL expression (B,E), localization of TRAP-positive cells/osteoclast (C,F). Positive cells (immunohistochemistry-brown, TRAP-purple), white arrows point to the osteoclasts, yellow arrows point to the osteoblasts. Scale bar = 50 μm.

