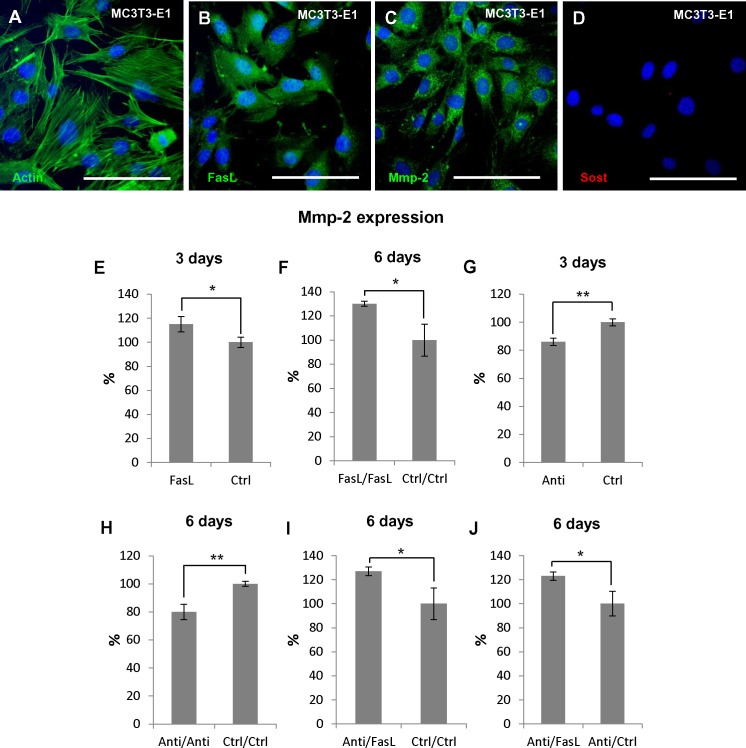
FIGURE 4.
Regulation of Mmp2 expression in osteoblastic precursors (MC3T3-E1) using rmFasL/anti-FasL. Immunoflourescent detection of actin filaments (A), FasL (B), Mmp2 (C), and Sost (D) in MC3T3-E1 cells. Actin filaments, FasL, and Mmp2 positive cells are green, nuclei are blue. Expression of Mmp2 (mRNA) after: 3 days of rmFasL application compared to untreated cells resulted in 15% increase, p = 0.0295 (E), 6 days of rmFasL application compared to untreated cells resulted in 30% increase, p = 0.0210 (F), 3 days of anti-FasL application compared to untreated cells resulted in 14% decrease, p = 0.0024 (G), 6 days of anti-FasL application compared to untreated cells resulted in 20%, p = 0.0048 (H), 3 days of anti-FasL application/3 days of rmFasL treatment compared to untreated cells resulted in 27% increase, p = 0.0303 (I), 3 days of anti-FasL application/3 days of rmFasL treatment compared to 3 days of anti-FasL application/3 days of untreated culture resulted in 23% increase, p = 0.0262 (J). For each group n = 3. Scale bar = 100 μm. ∗p ≤ 0.05 and ∗∗p ≤ 0.01.

